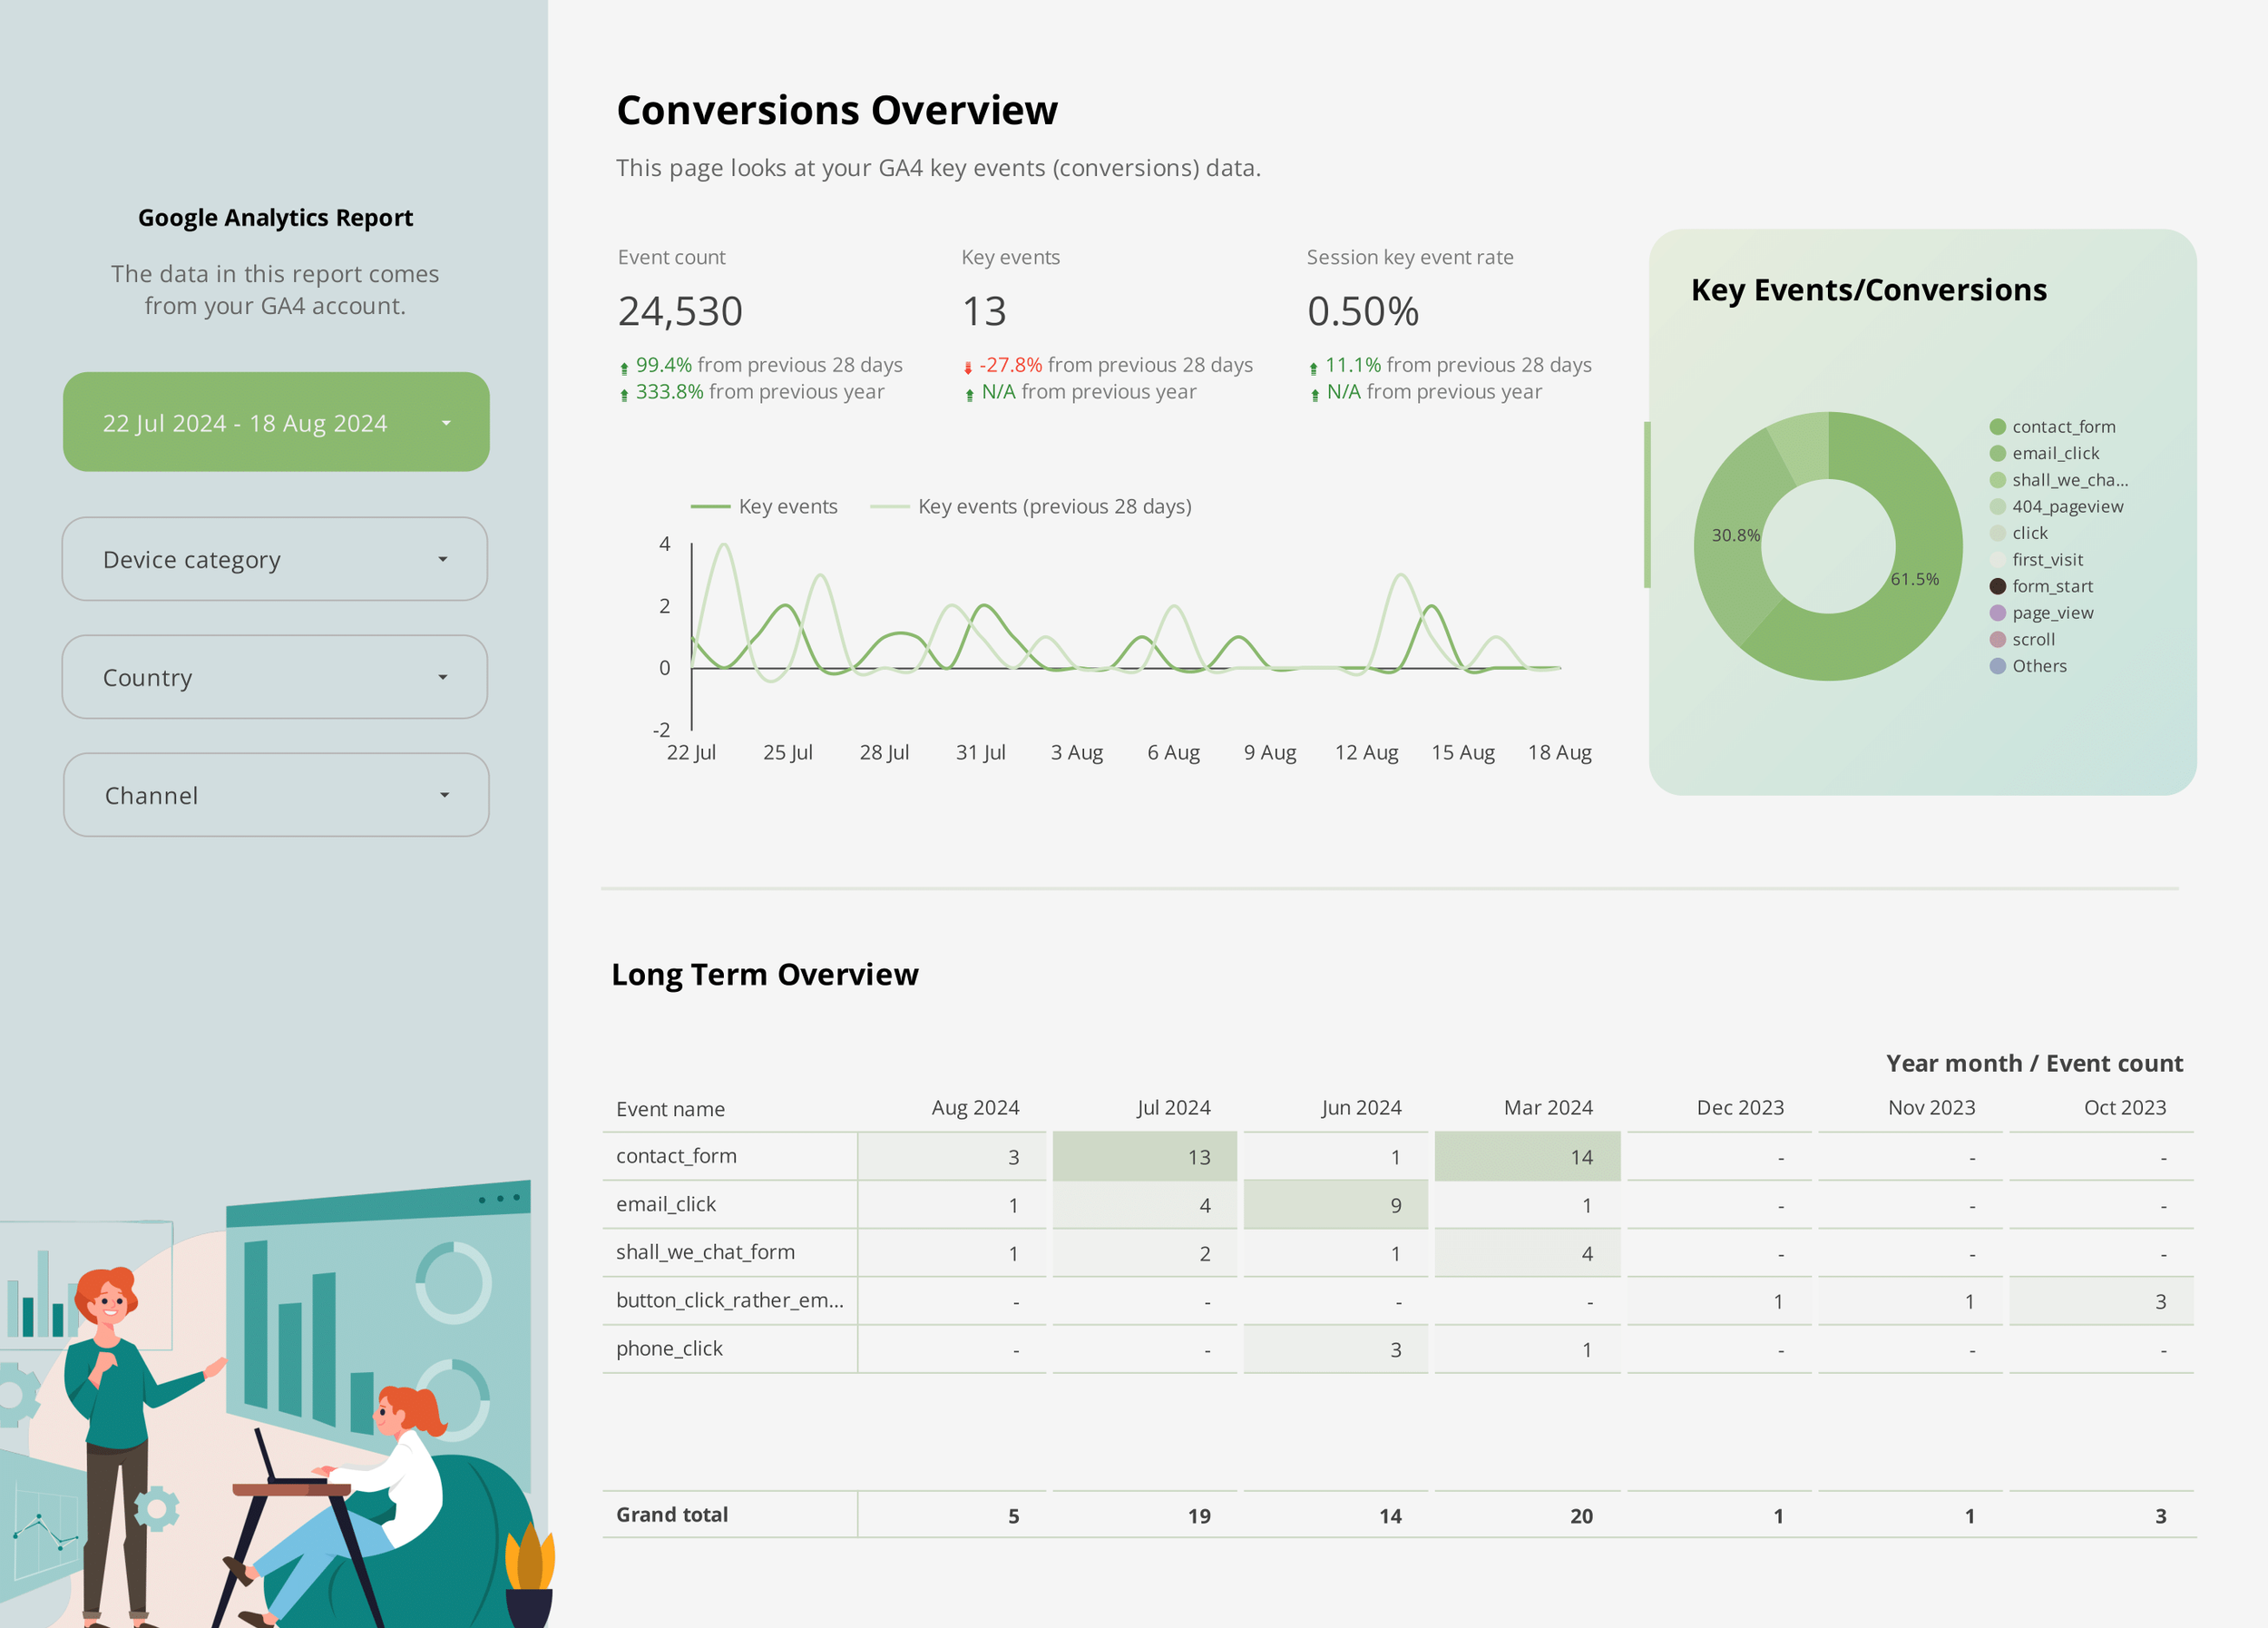
 Image 1 of 5

 Image 2 of 5

 Image 3 of 5

 Image 4 of 5

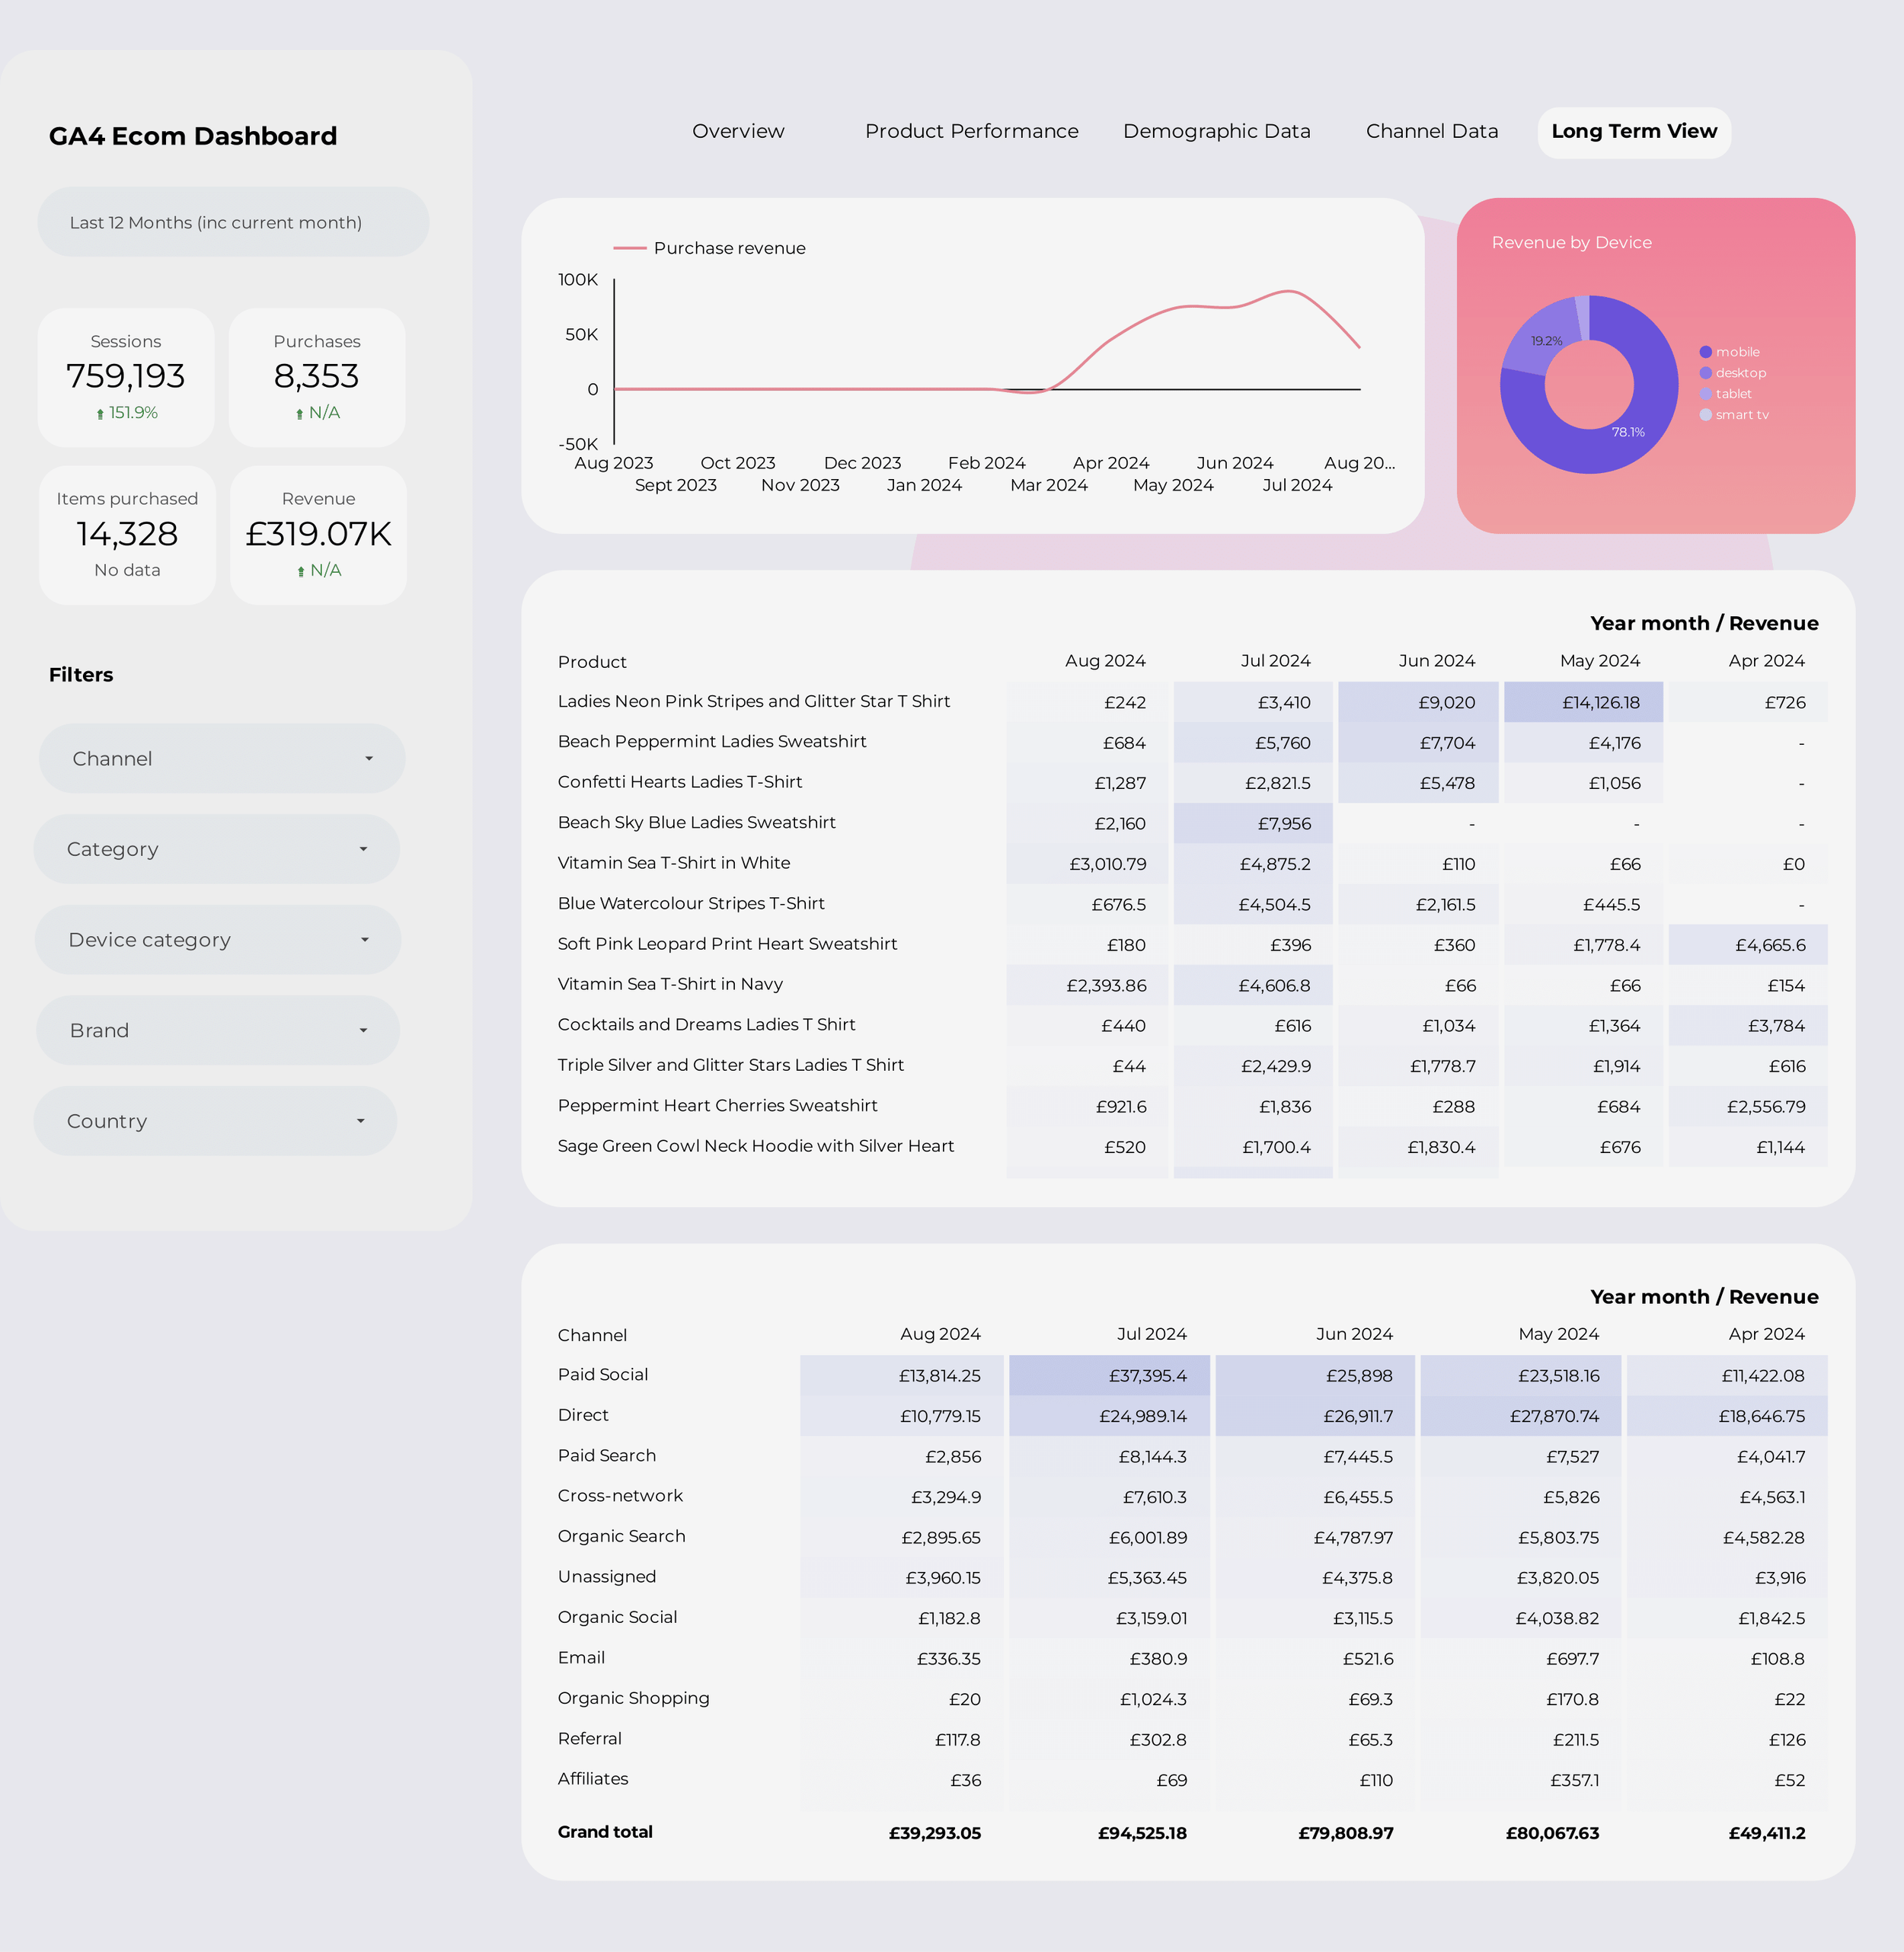 Image 5 of 5

GA4 E-commerce Dashboard
Note: This report uses data from your Google Analytics 4 (GA4) account.
The GA4 E-commerce Dashboard is an essential tool for any online retailer looking to get the most out of their Google Analytics 4 data. This powerful report template provides in-depth insights into your sales, product performance, and customer behavior, enabling you to make data-driven decisions that boost your online store's profitability.
About This Template
Purchasing this template grants you access to make a copy of the report in your own Looker Studio. By purchasing this template, you agree to our Template Usage Agreement.
What Questions Does This Report Answer?
How are my sales performing over time?
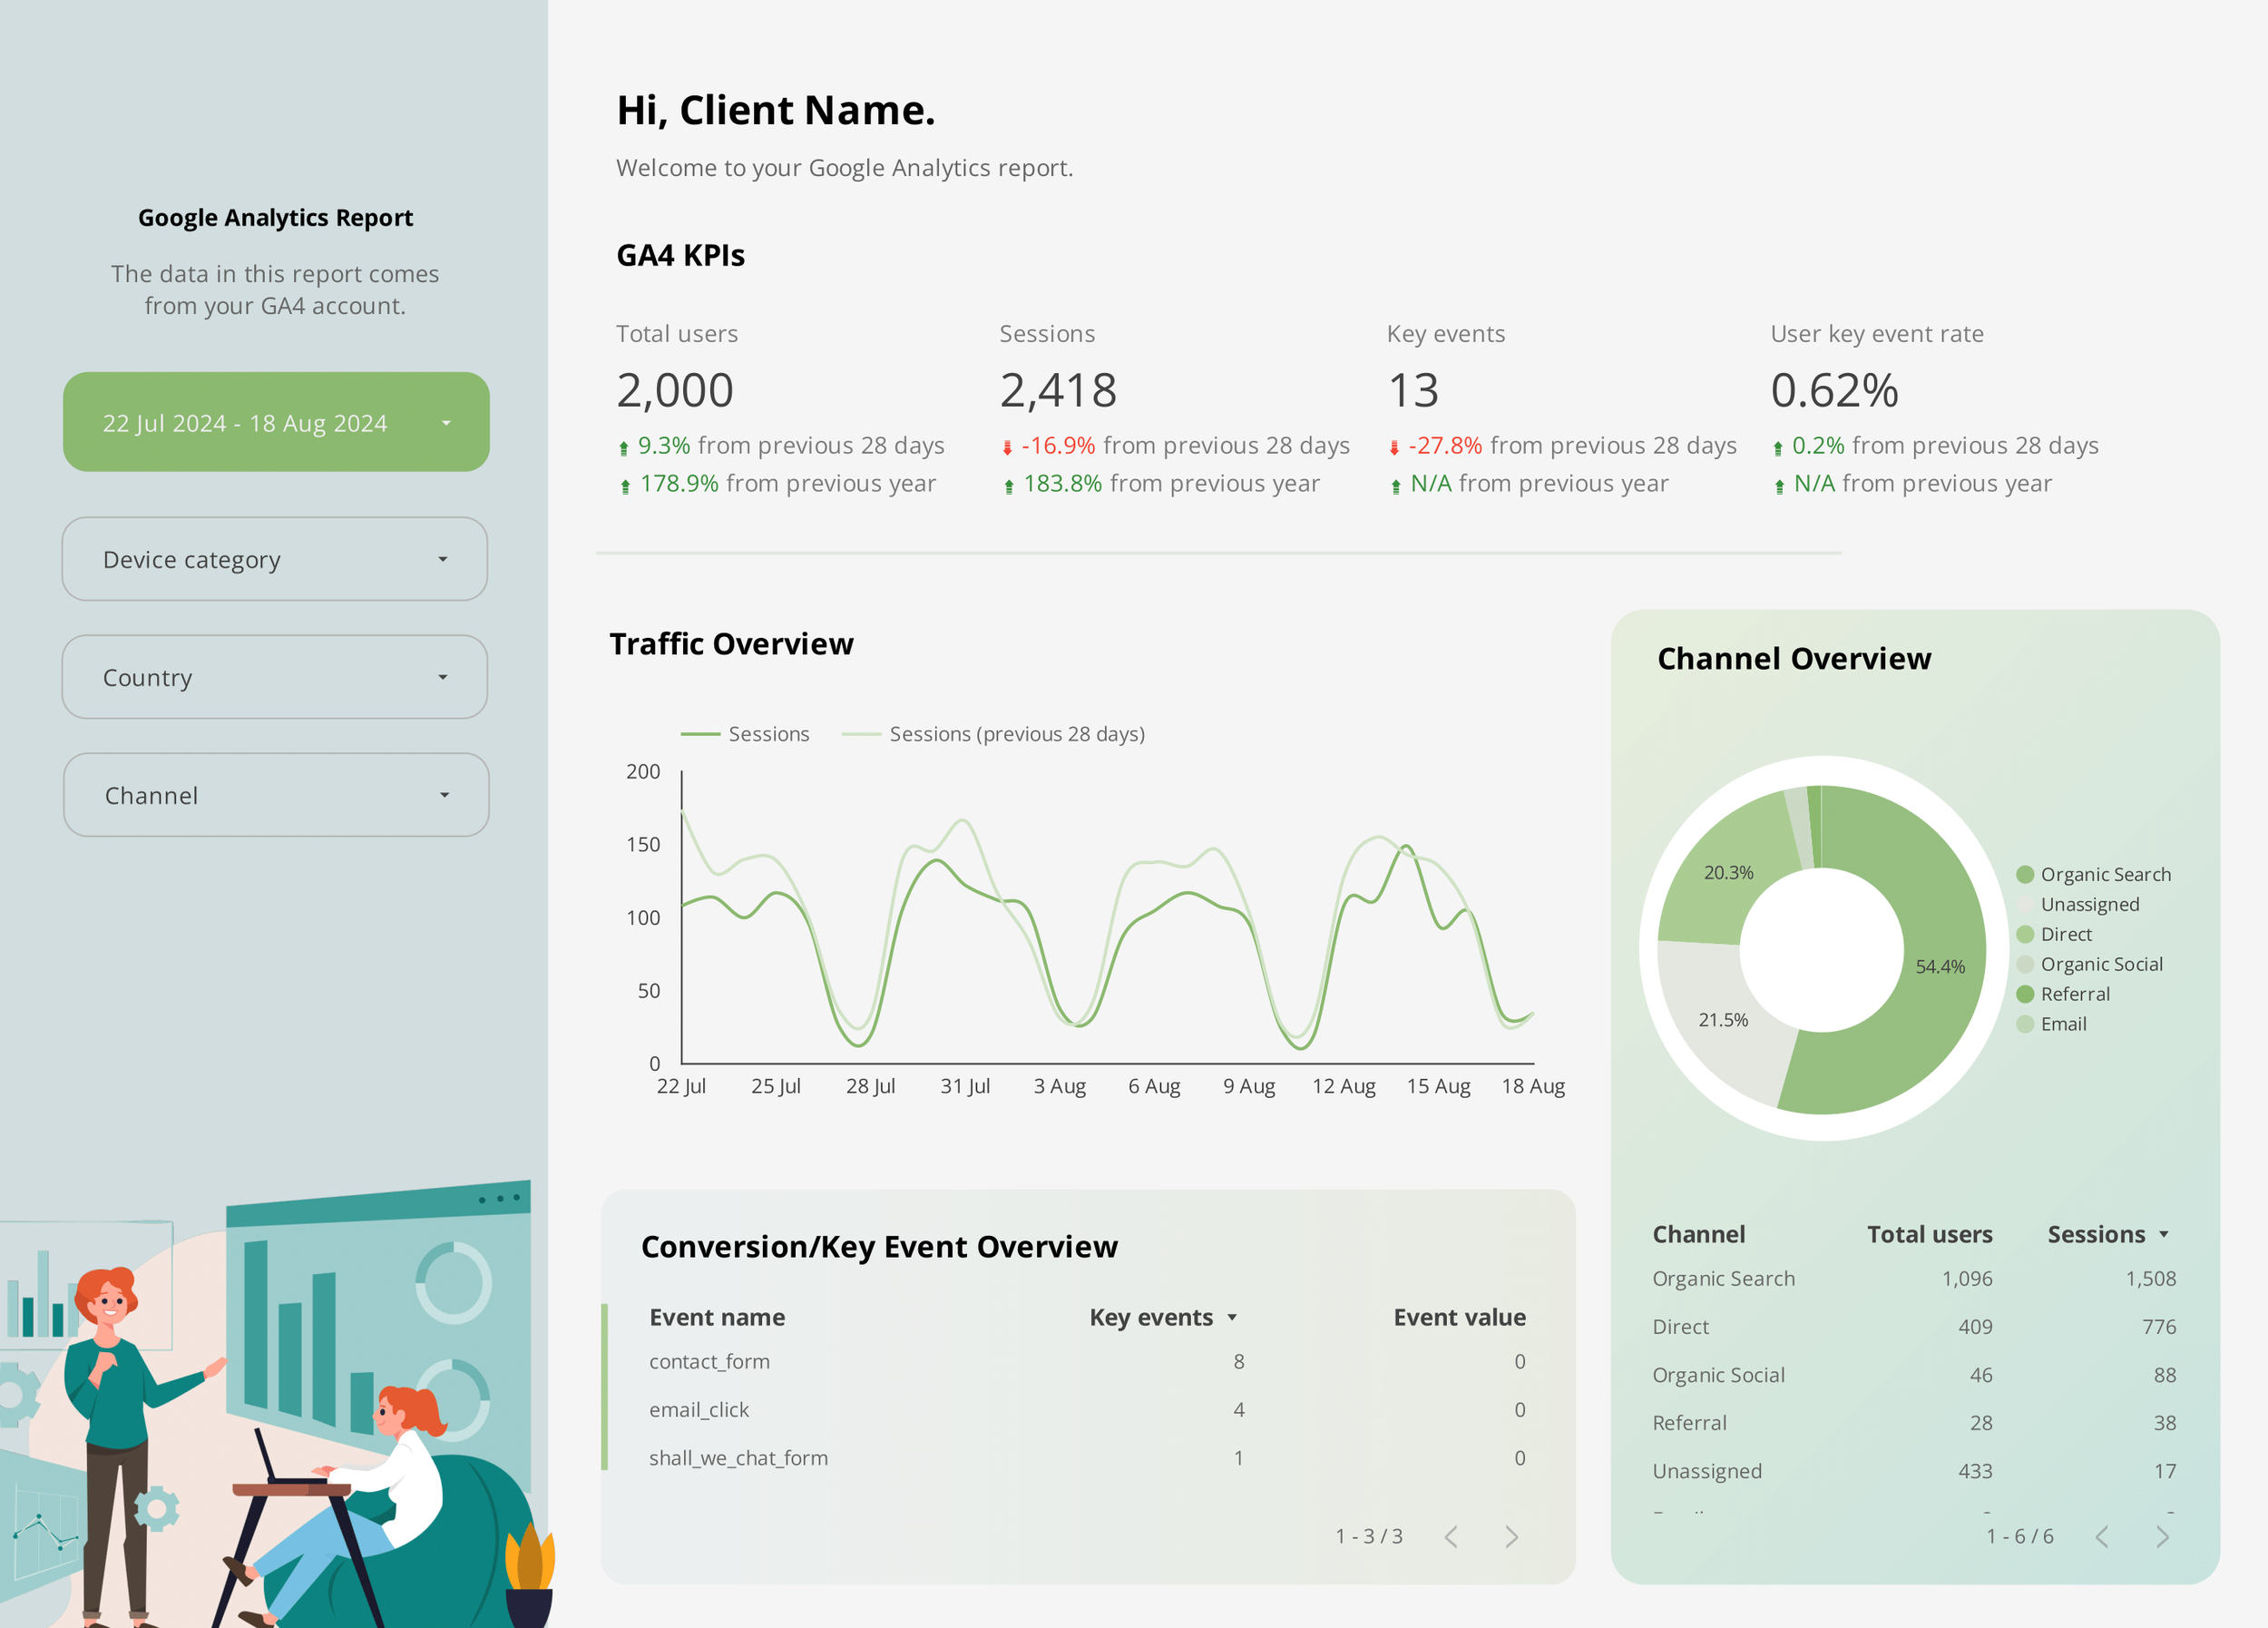
Track your purchase revenue, sessions, and conversion rates across different time periods to monitor your store's performance and identify trends.
Which products are generating the most revenue?
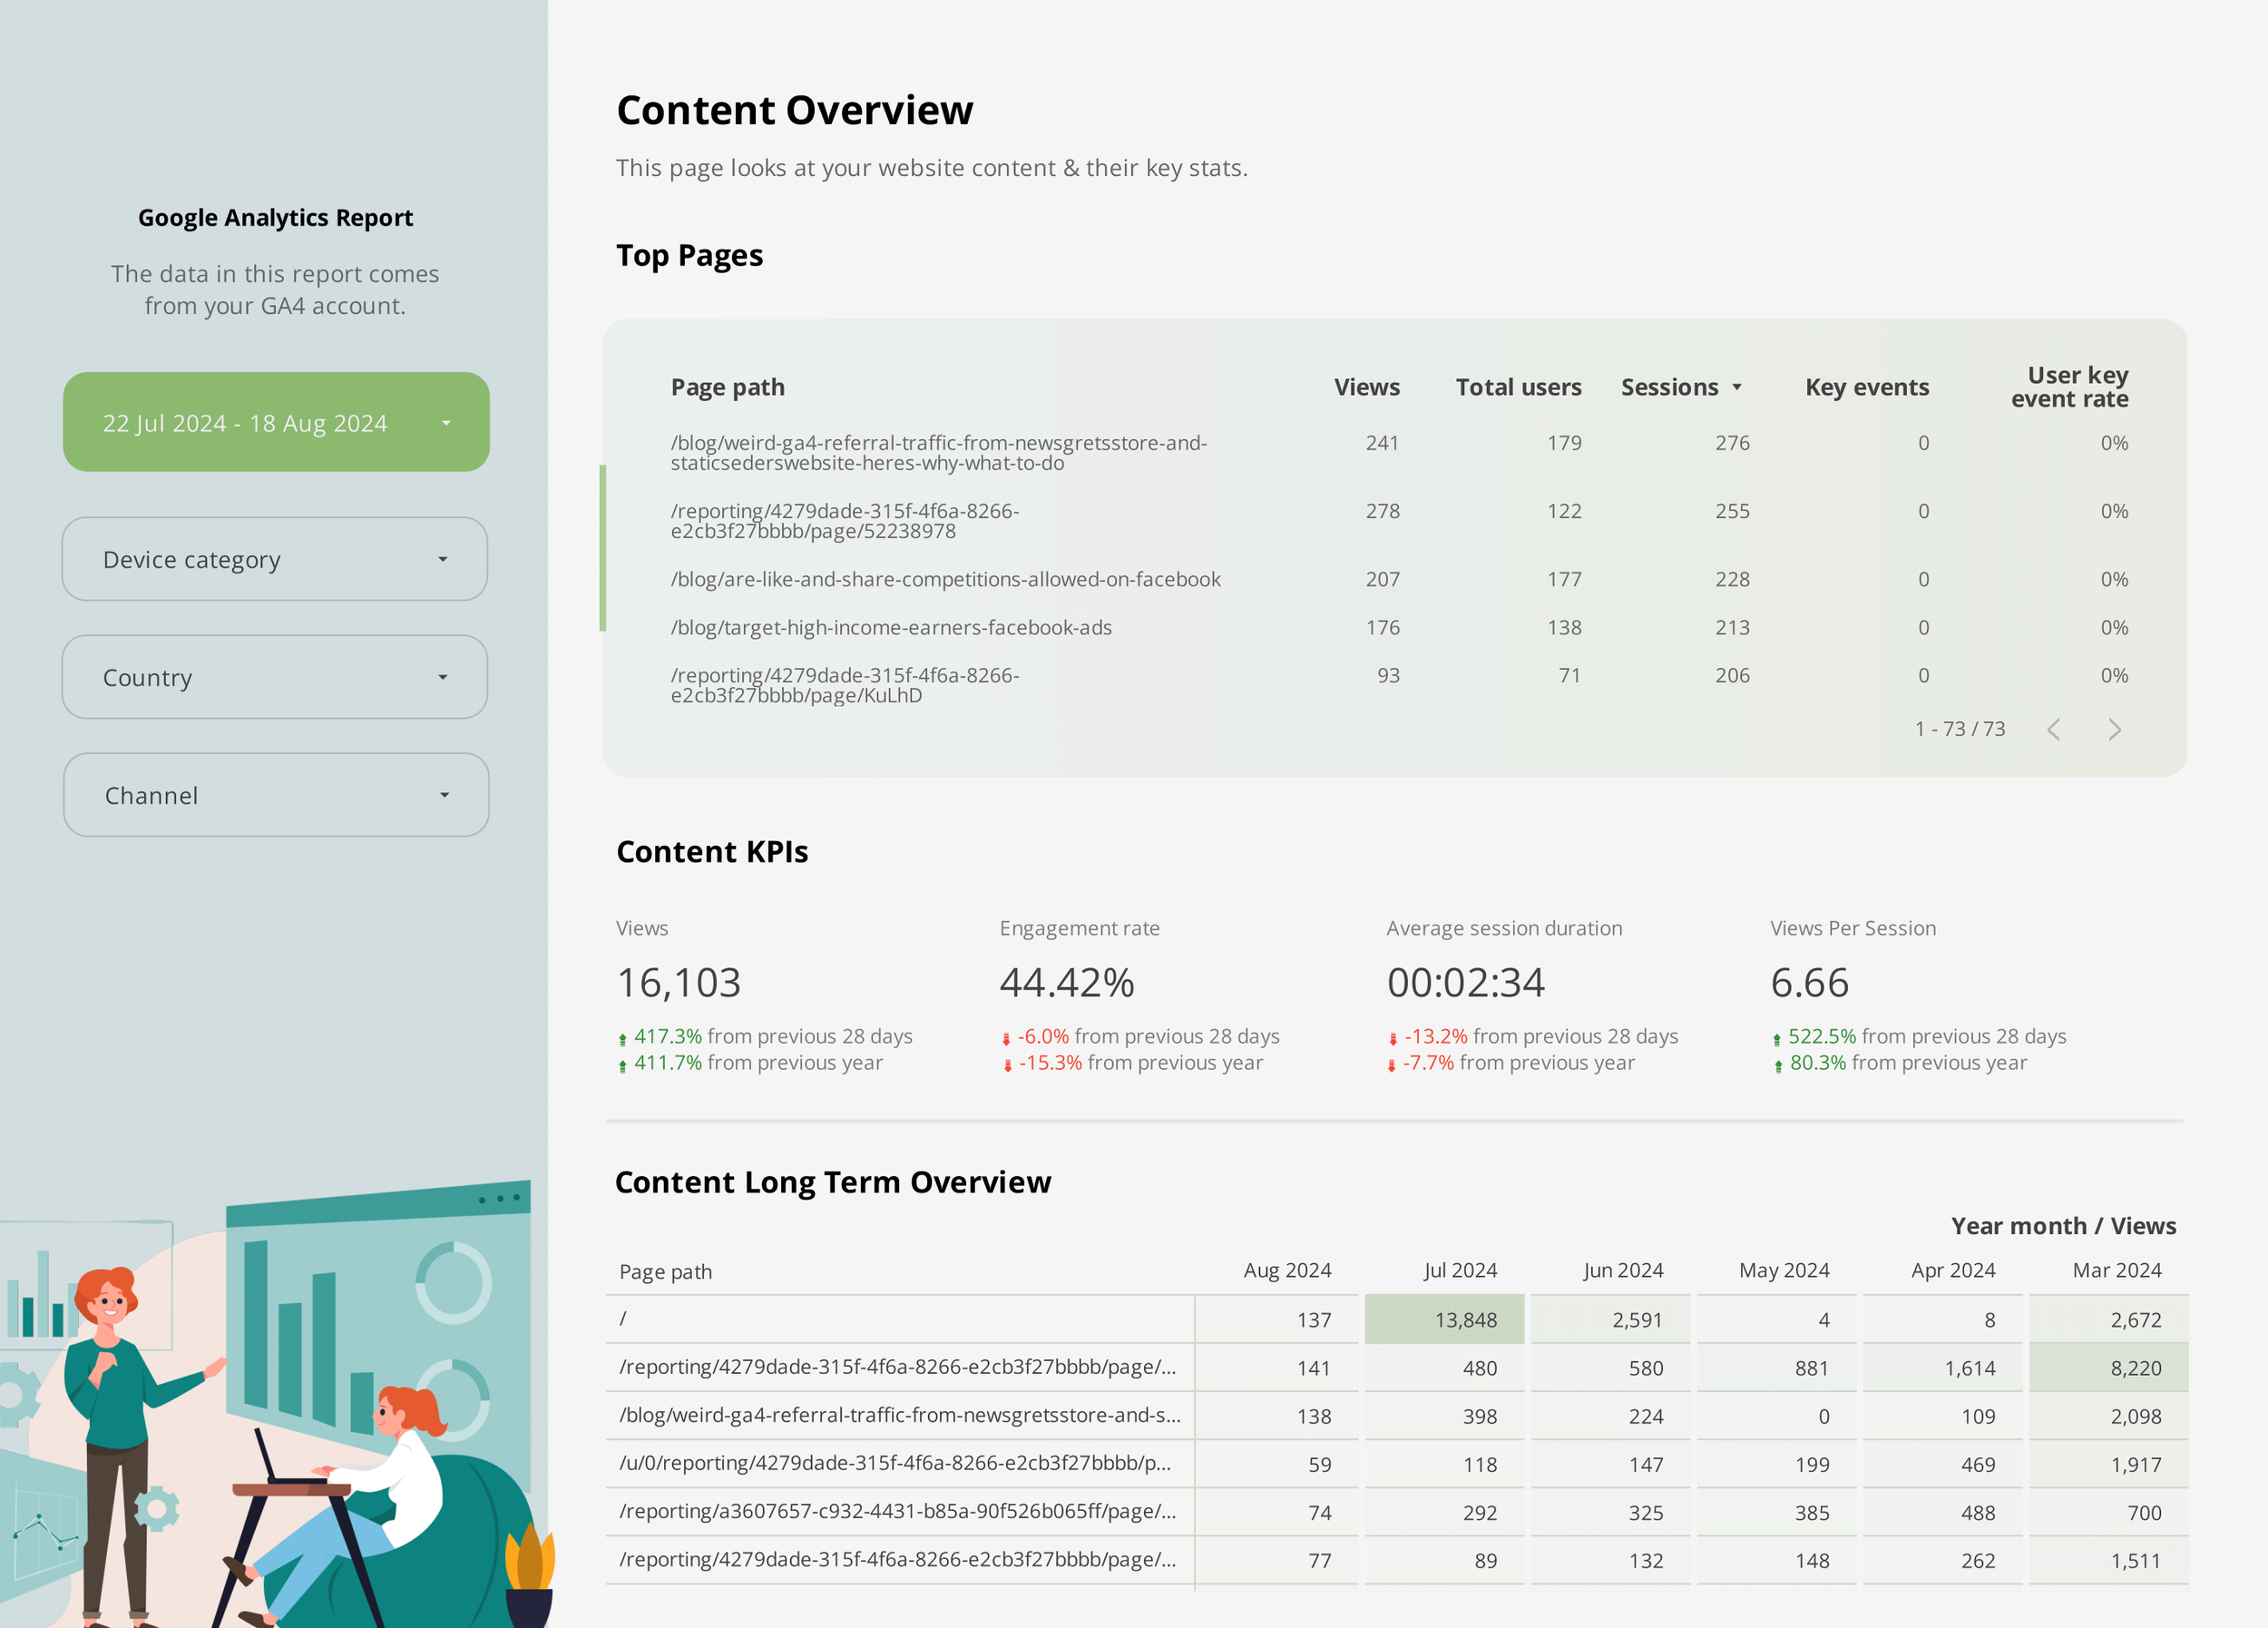
Analyze the performance of individual products, including metrics like items viewed, added to cart, and purchased, to see which items are driving your sales.
Which channels are the most effective for driving sales?
Determine which marketing channels (e.g., Paid Social, Organic Search, Direct) are generating the most sessions, purchases, and revenue, allowing you to optimize your marketing spend.
How do different customer segments perform?
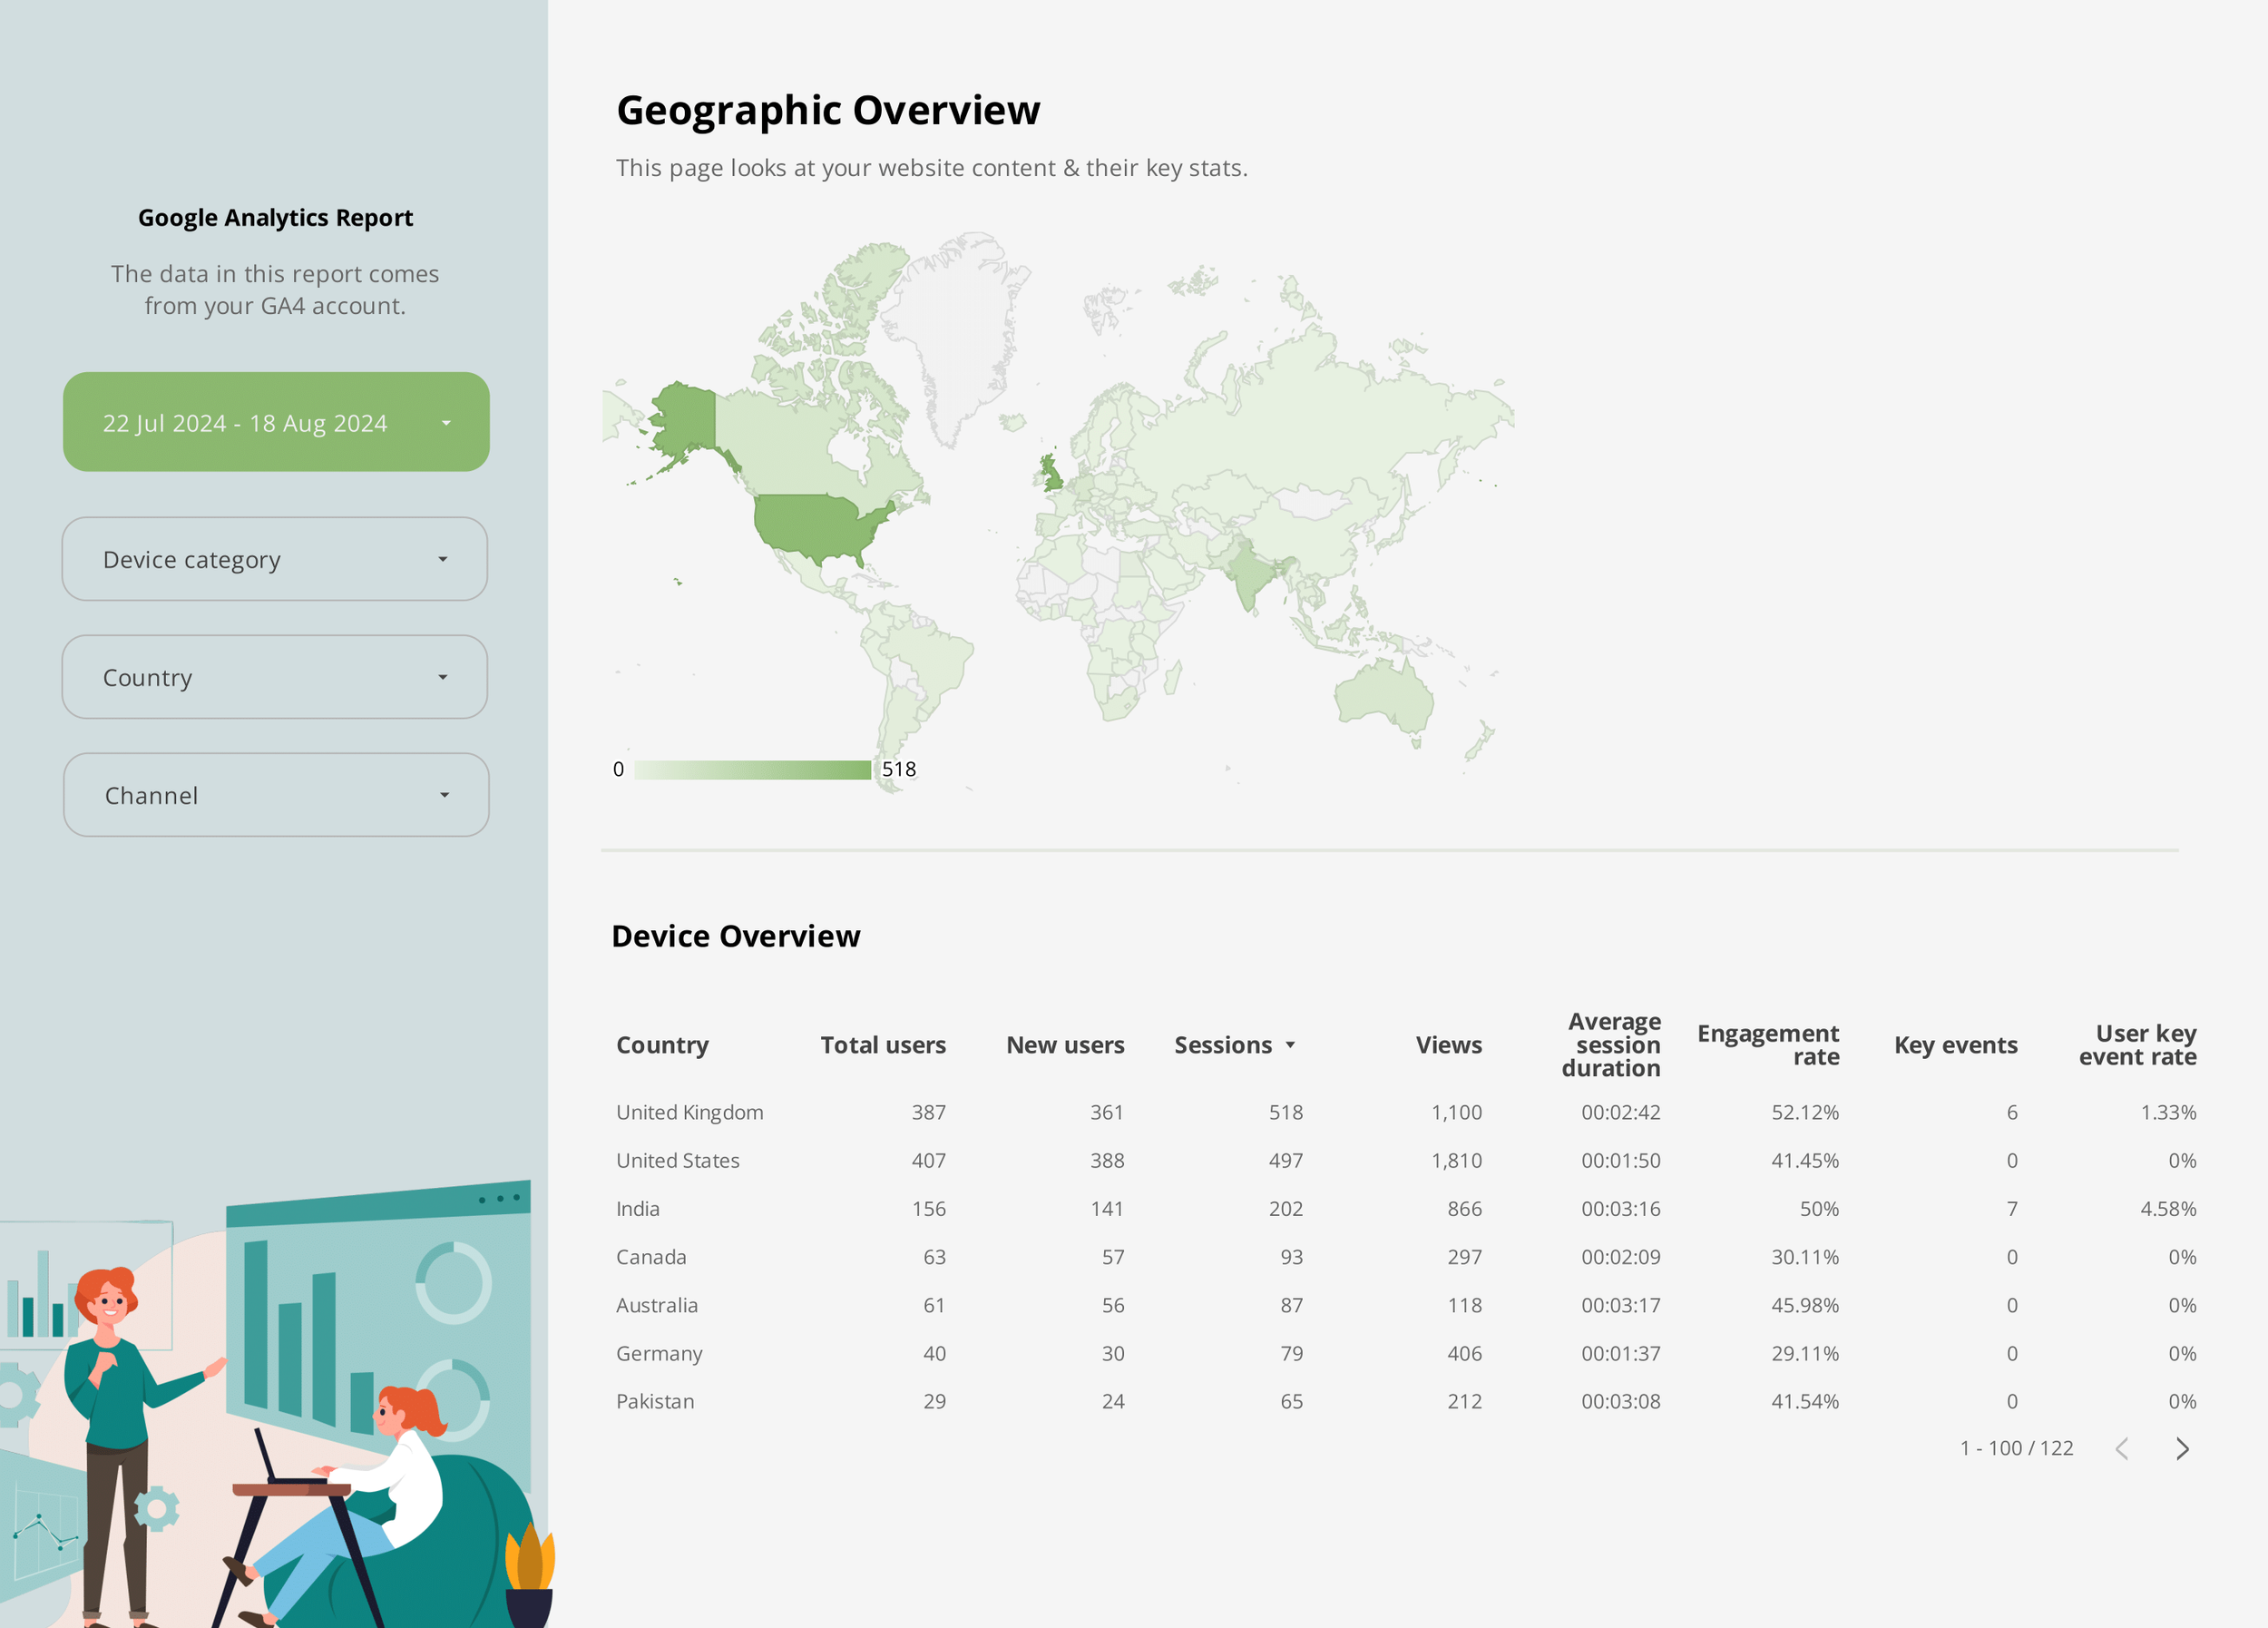
Understand the behavior of different customer demographics, including age, gender, and location, to tailor your marketing efforts and product offerings.
What are the long-term trends in my e-commerce data?
Review the long-term performance of your store, with data on sessions, purchases, and revenue, to assess the effectiveness of your overall strategy over the past 12 months.
Key Features
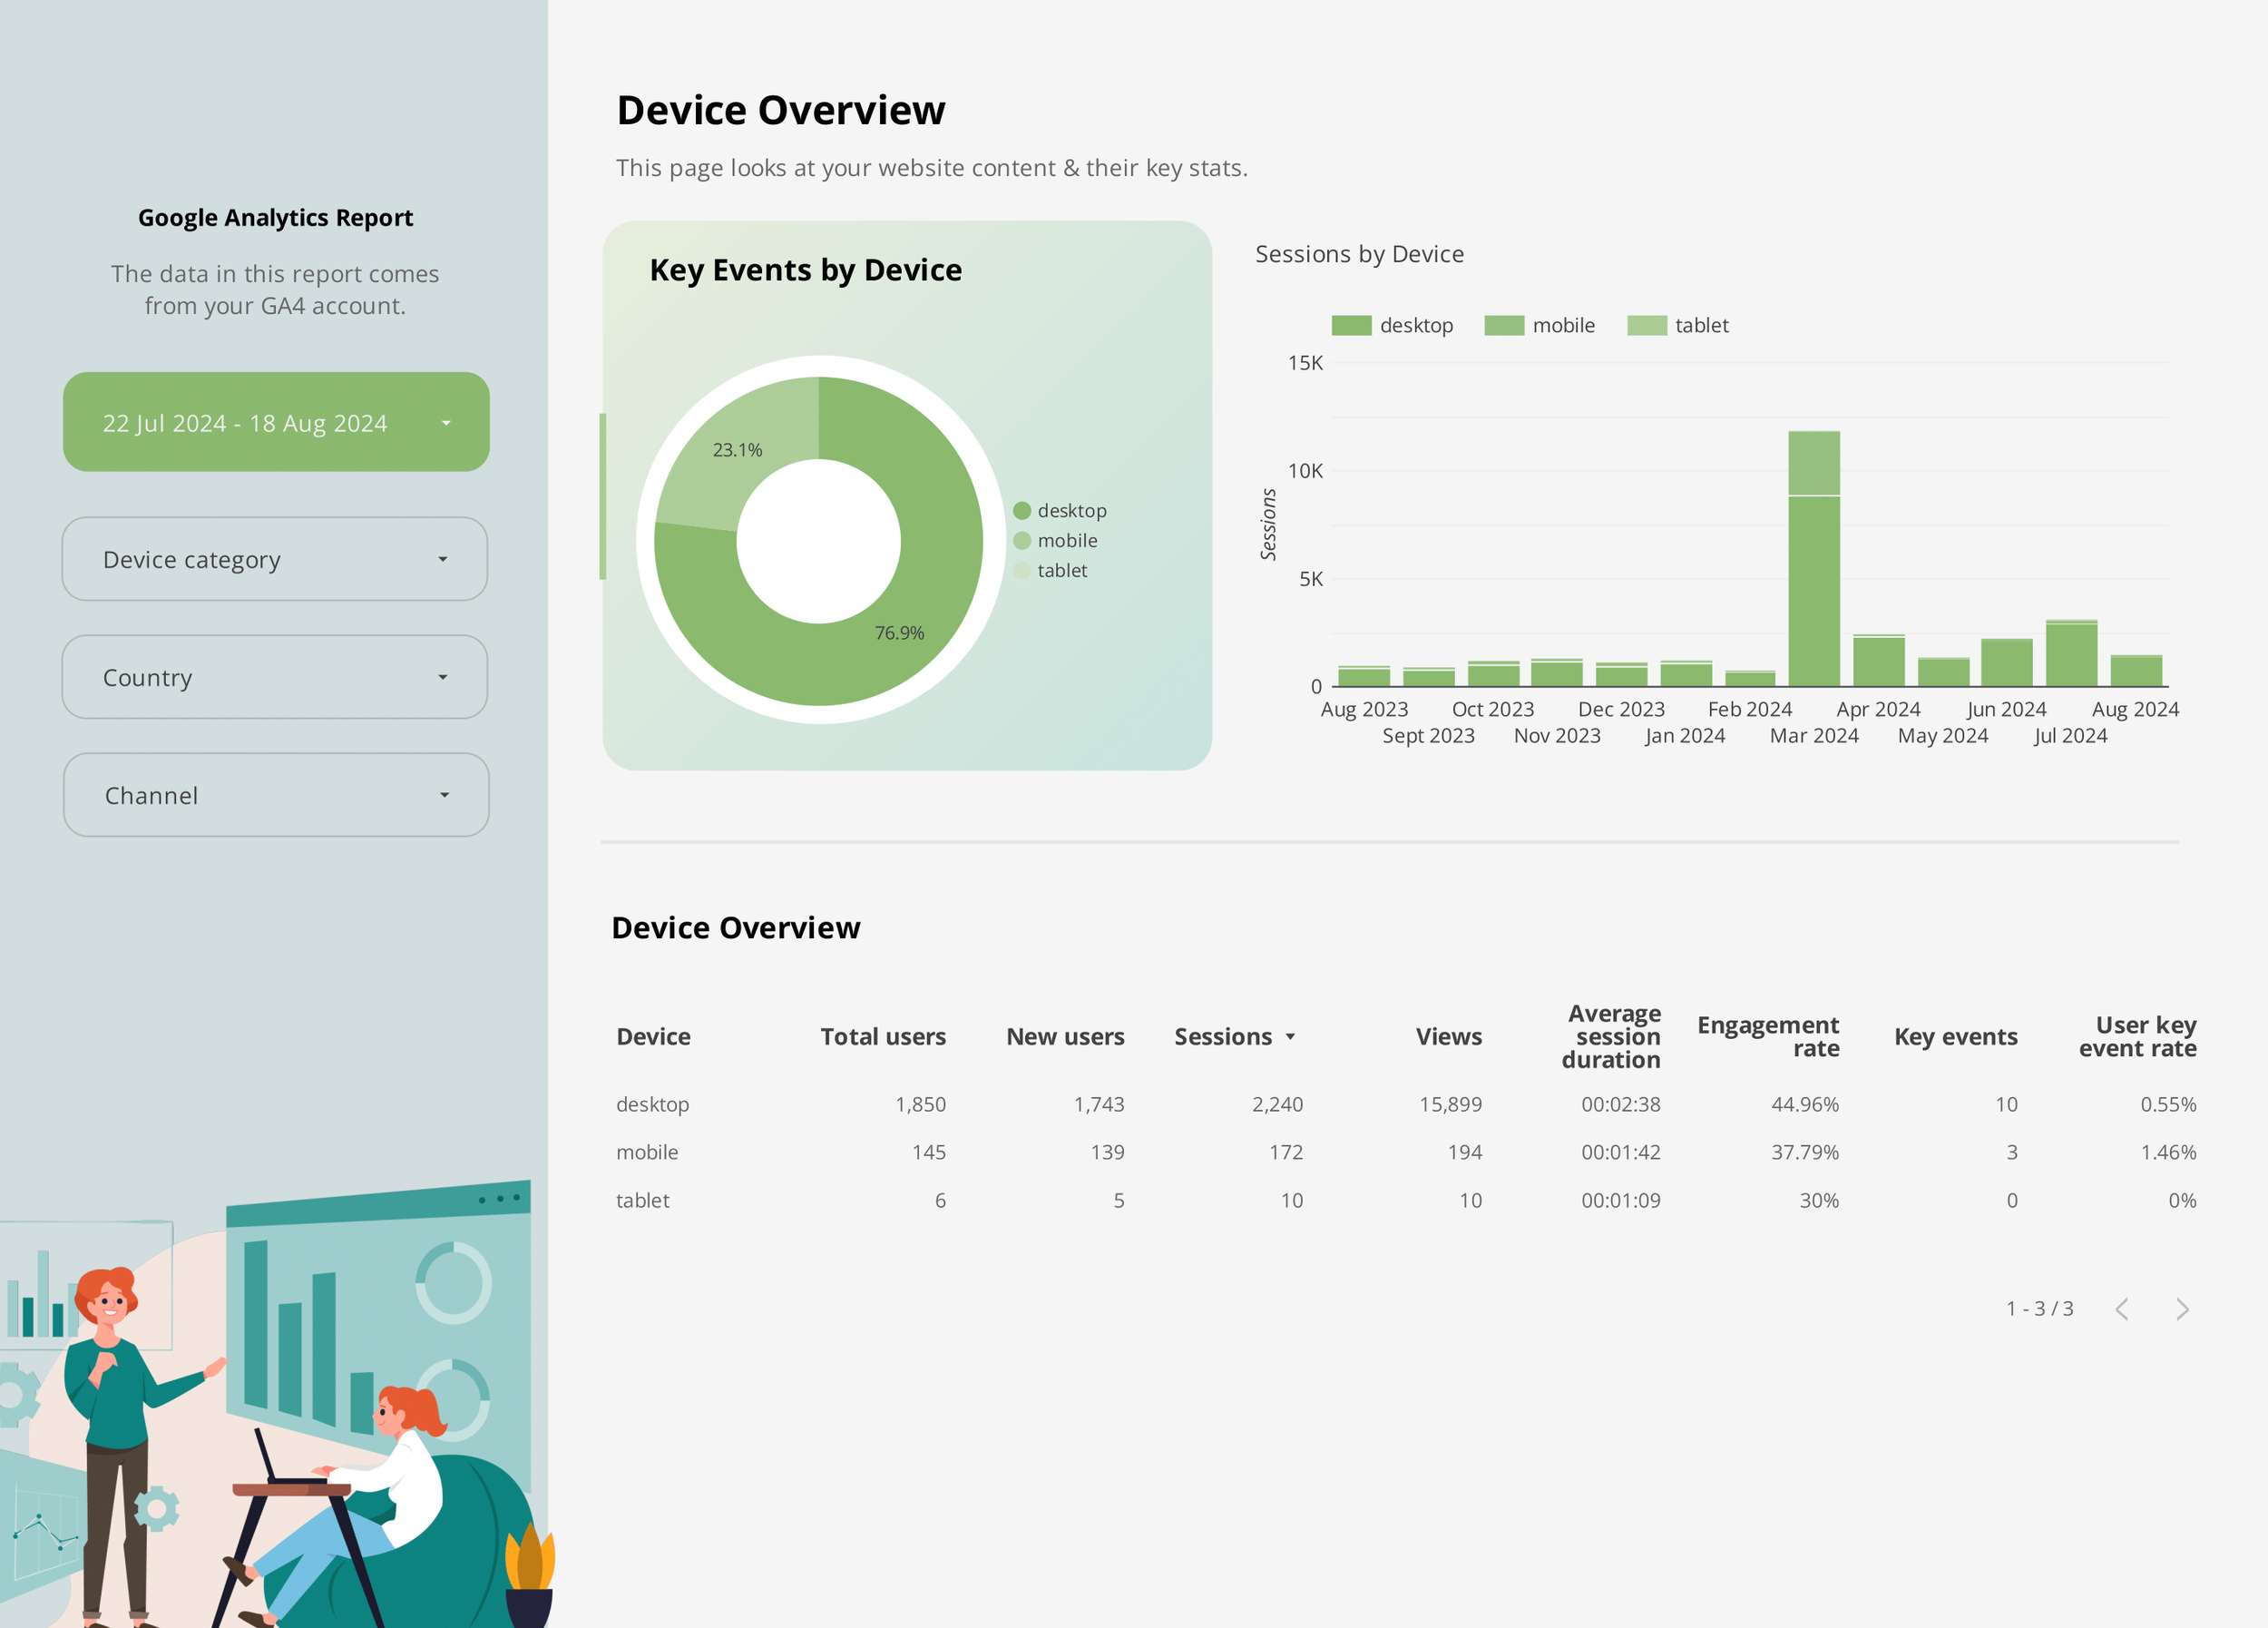
Revenue Tracking: Keep a close eye on your store's revenue with detailed breakdowns by product, channel, and device.
Product Performance Insights: Get granular data on how each product performs, from views to purchases, helping you identify best-sellers and underperforming items.
Channel Analysis: See which marketing channels are the most effective at driving sales and revenue, enabling you to allocate your budget more efficiently.
Customer Demographics: Analyze the demographics of your customers to better understand your audience and improve your targeting strategies.
Long-Term Performance: Monitor long-term trends to evaluate the impact of your e-commerce strategy over time and make informed decisions.
How It Works
Purchase the Template
Buy the template from our store. After your purchase is complete, you’ll receive a confirmation email with a PDF document attached.
Receive a PDF Guide
The PDF guide includes detailed instructions and a link to the Looker Studio report. This guide will walk you through the process of accessing the report and making a copy for your own use.
Access the Looker Studio Report
Use the link provided in the PDF to access the Looker Studio report. Once you’re on the Looker Studio platform, you can follow the instructions to make a copy of the report.
Set Up Your Data Sources
After making a copy, follow the PDF instructions to connect your accounts to the report. This setup ensures your data is accurately reflected in the dashboard.
Customize and Share
Once your data sources are connected, you can customize the report to suit your specific needs.


