 Image 1 of


Let's Make GA4 Simple - Looker Studio Dashboard Report
Note: This report uses data from your Google Analytics 4 (GA4) account.
The GA4 Simplified Dashboard is designed for businesses, freelancers, and agencies who need an easy-to-understand, high-level overview of their Google Analytics 4 data. This template provides all the essential metrics in a clear, concise format, making it perfect for sharing with clients who may struggle with navigating the GA4 interface. Give your clients the insights they need without overwhelming them with unnecessary details.
About This Template
Purchasing this template grants you access to make a copy of the report in your own Looker Studio. By purchasing this template, you agree to our Template Usage Agreement.
What Questions Does This Report Answer?
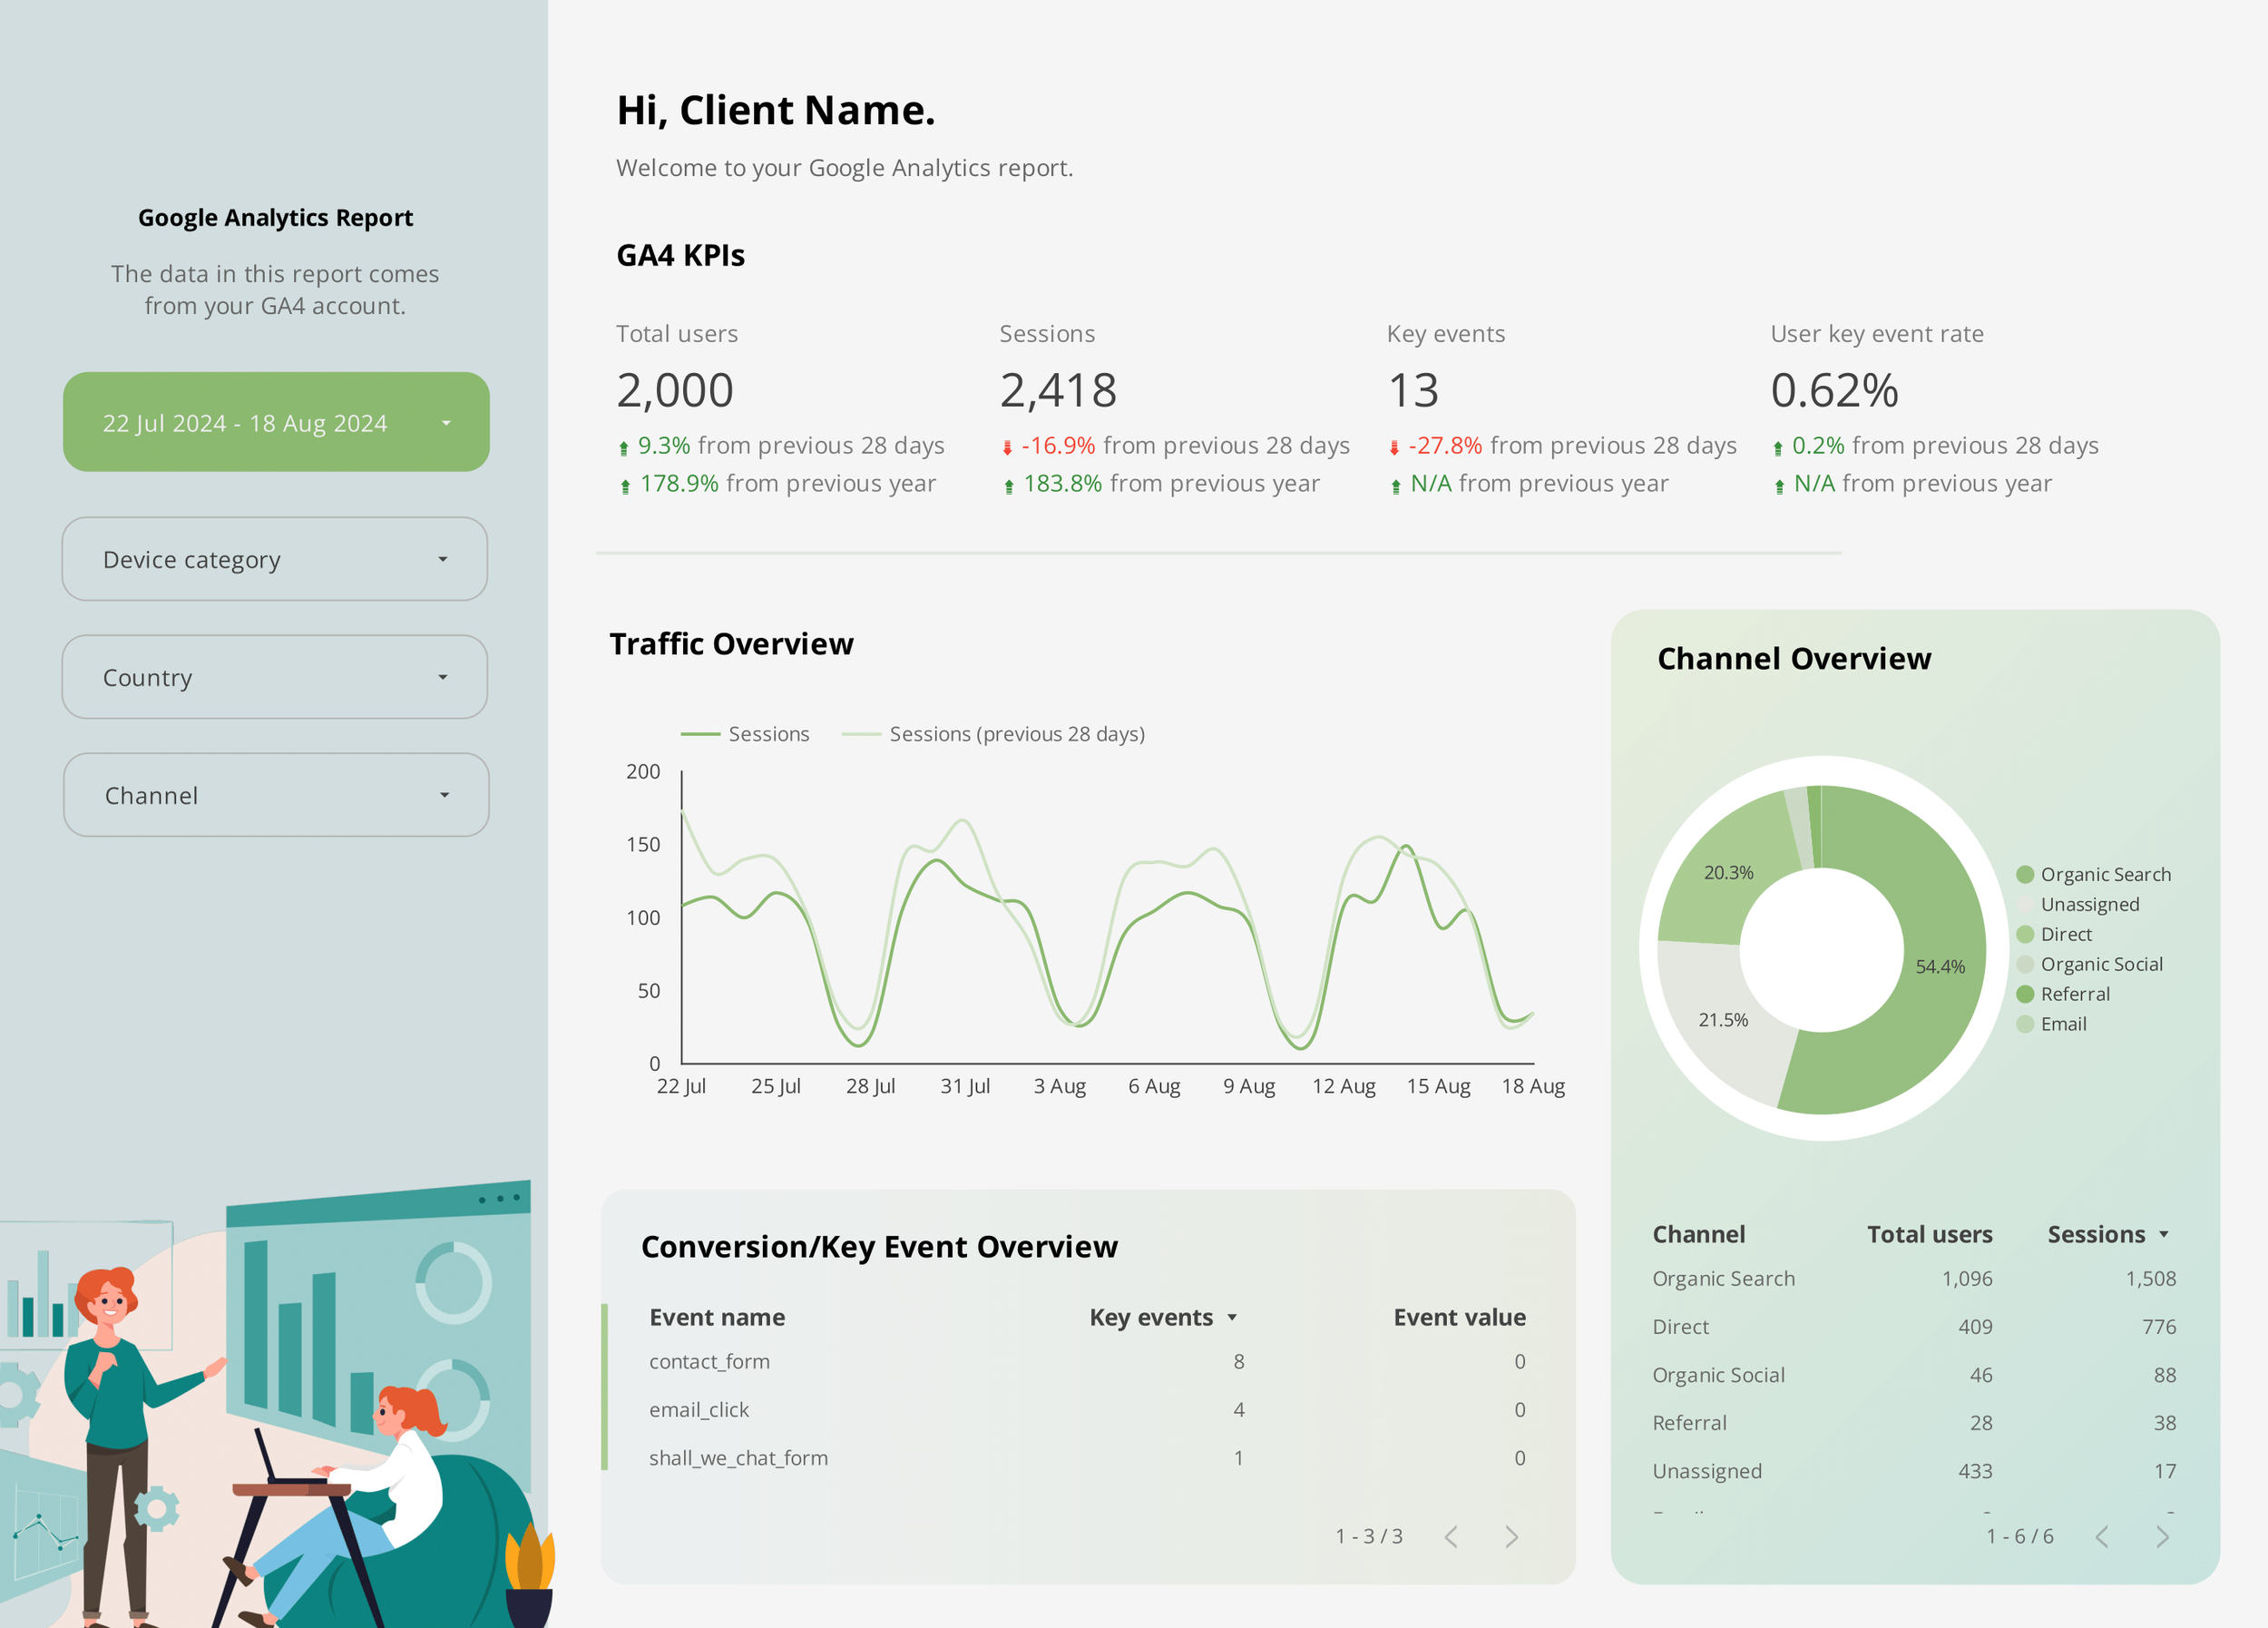
What are the key traffic metrics for my website?
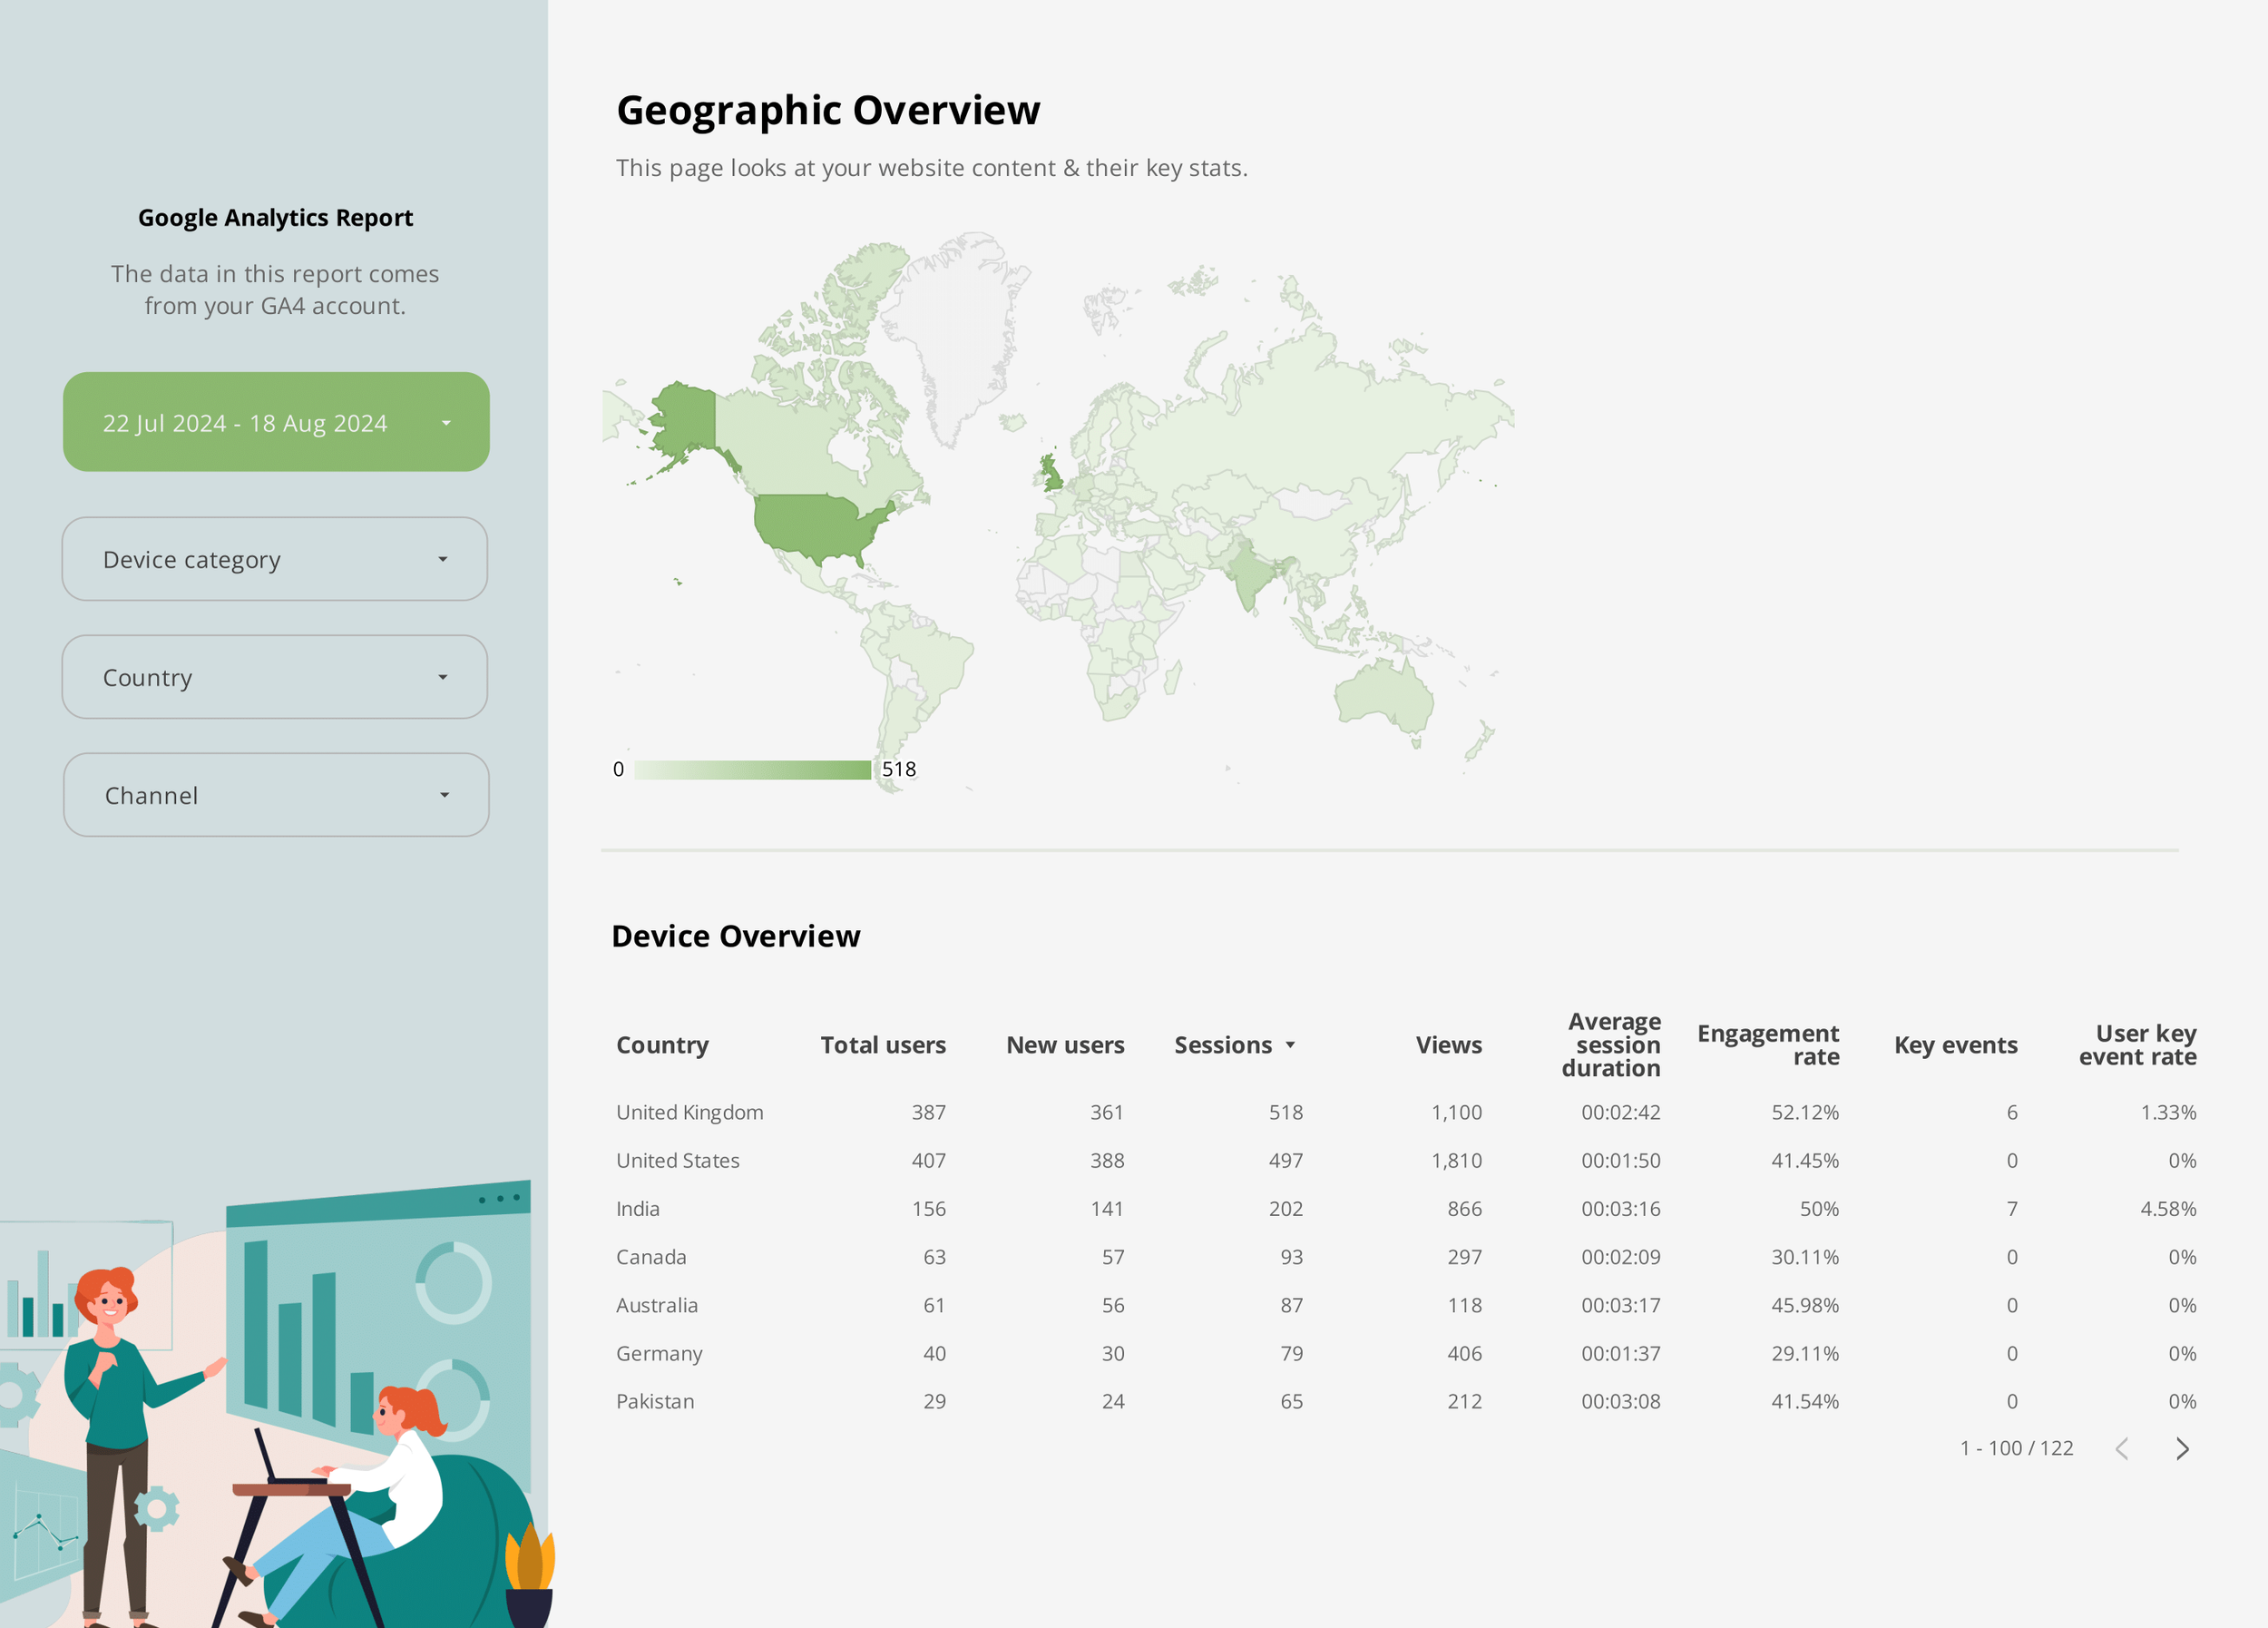
Get a quick overview of total users, sessions, and key events, with the ability to filter by channel, country, or device category for more detailed insights.
Which channels are driving the most traffic?
Understand which channels (e.g., Organic Search, Direct, Social) are contributing the most to your website's traffic and user engagement.
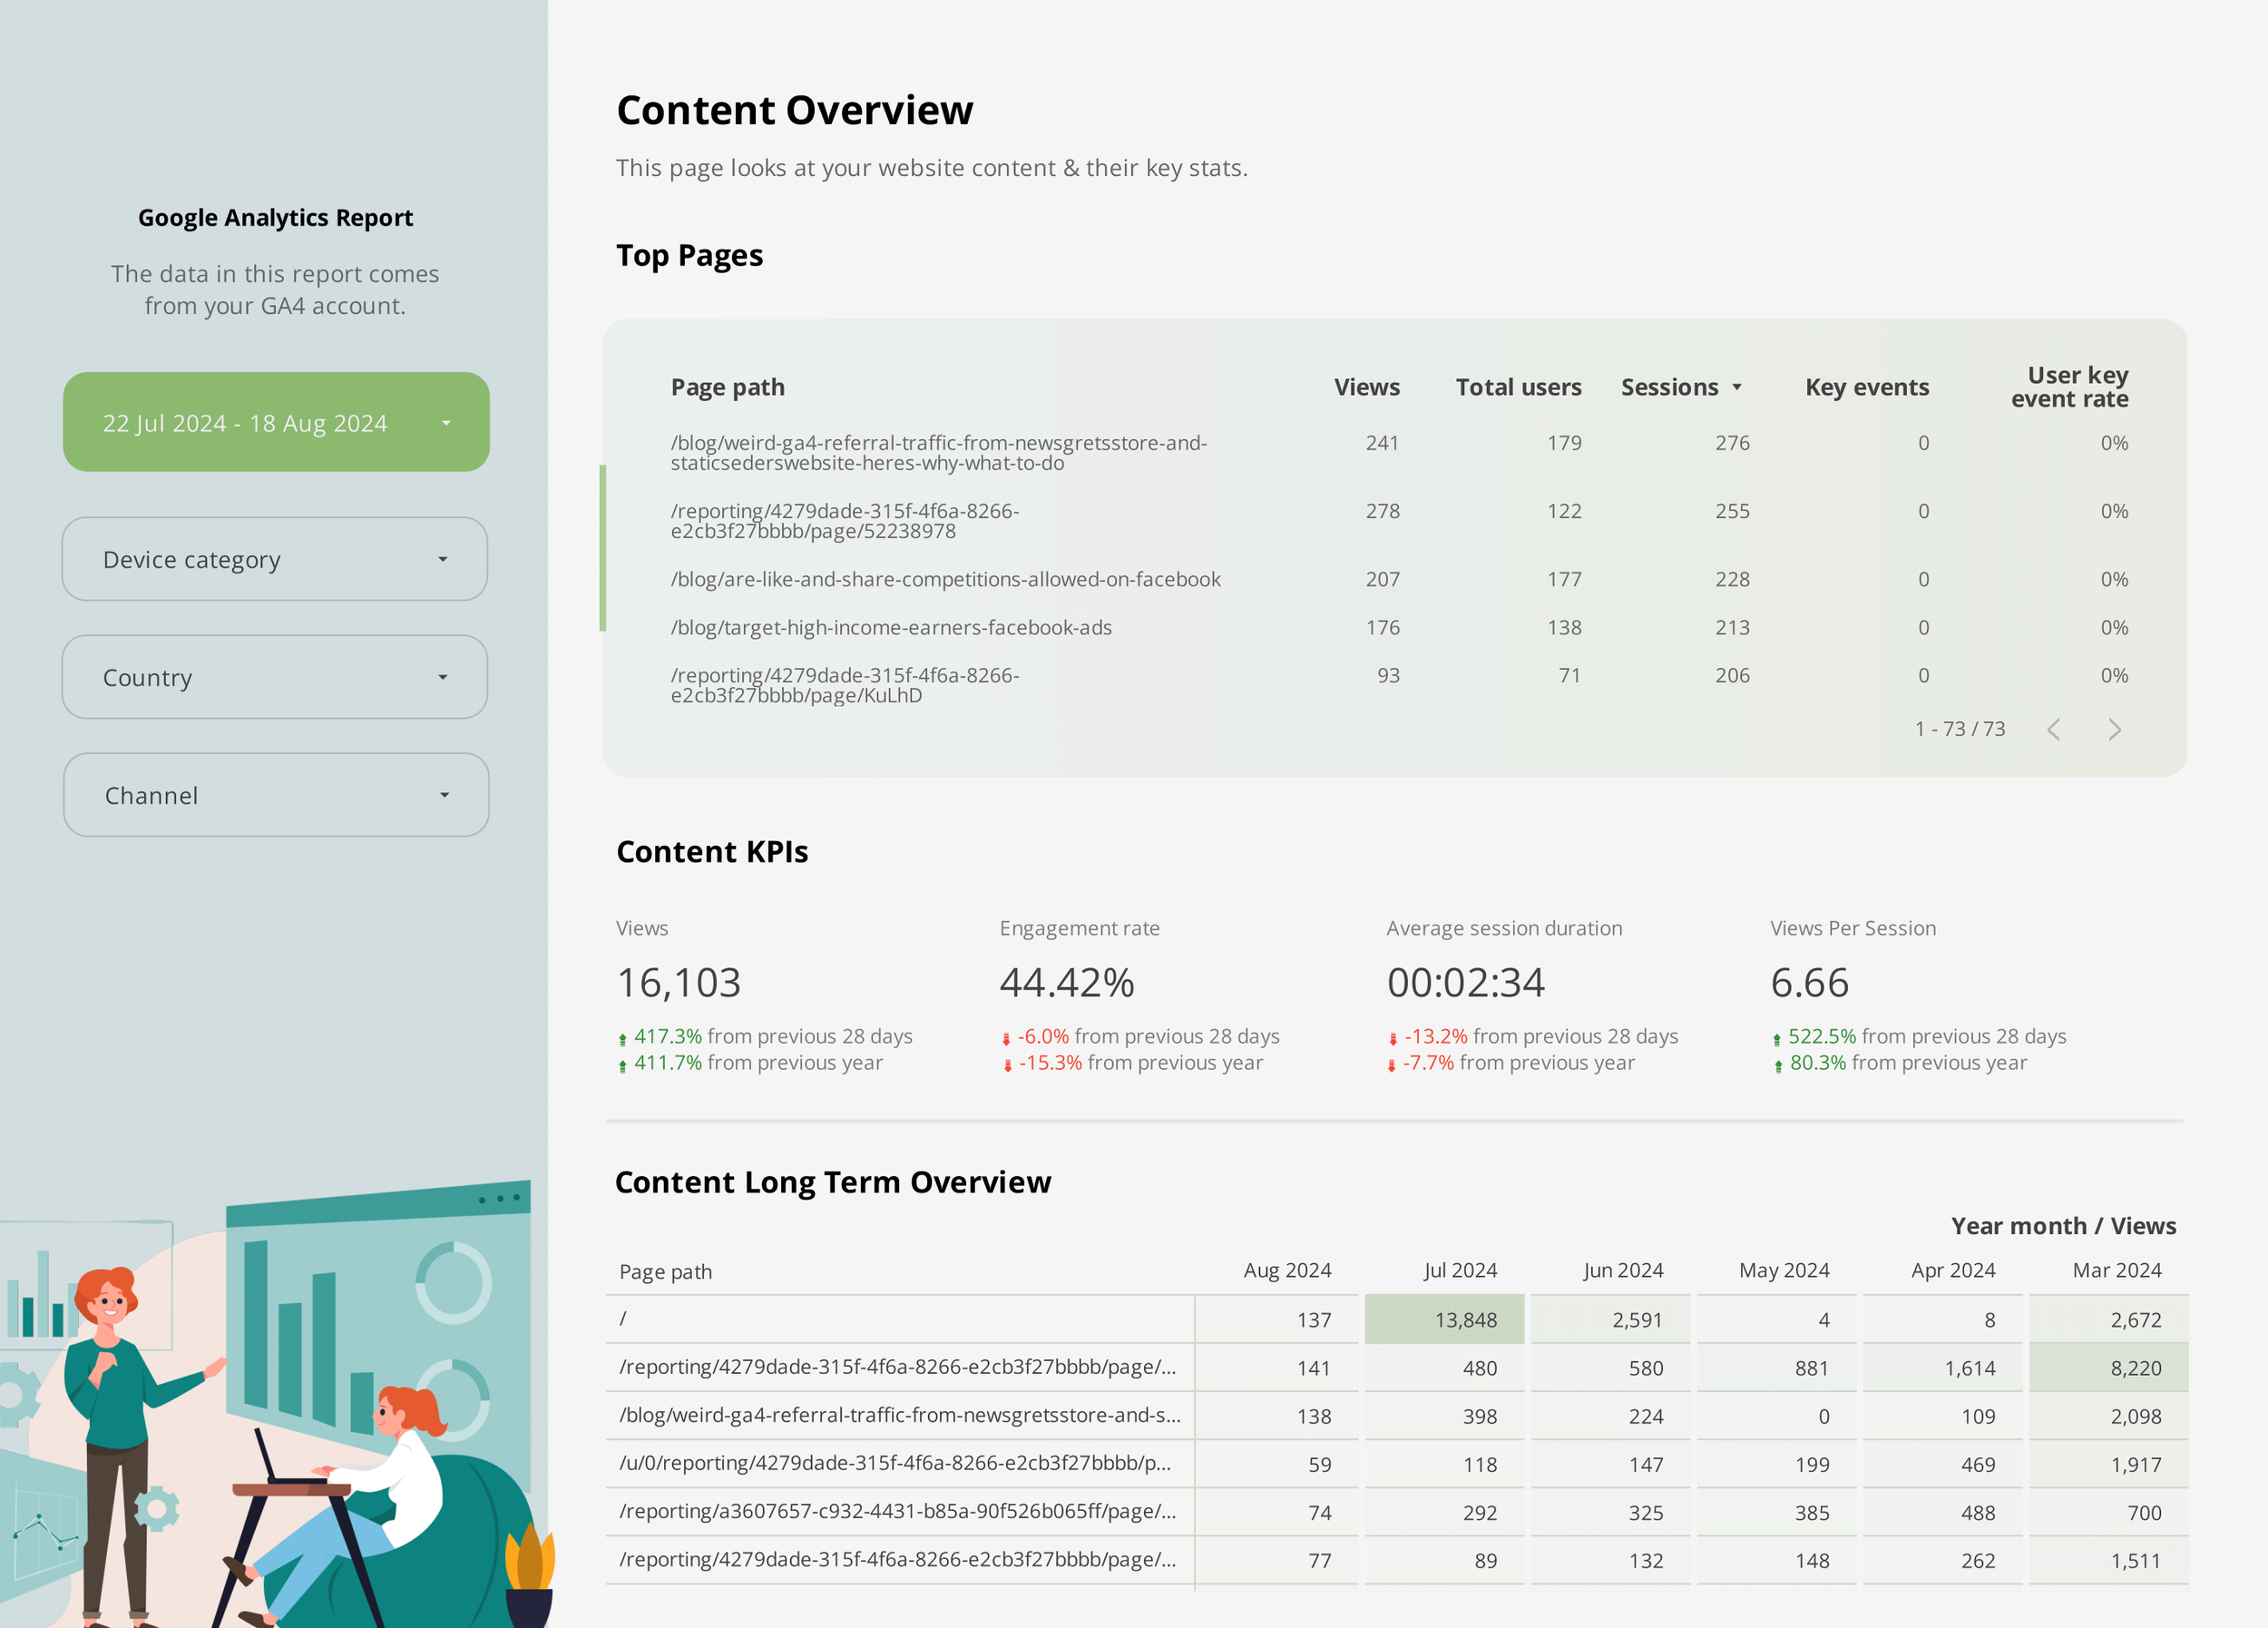
How is my audience engaging with my content?
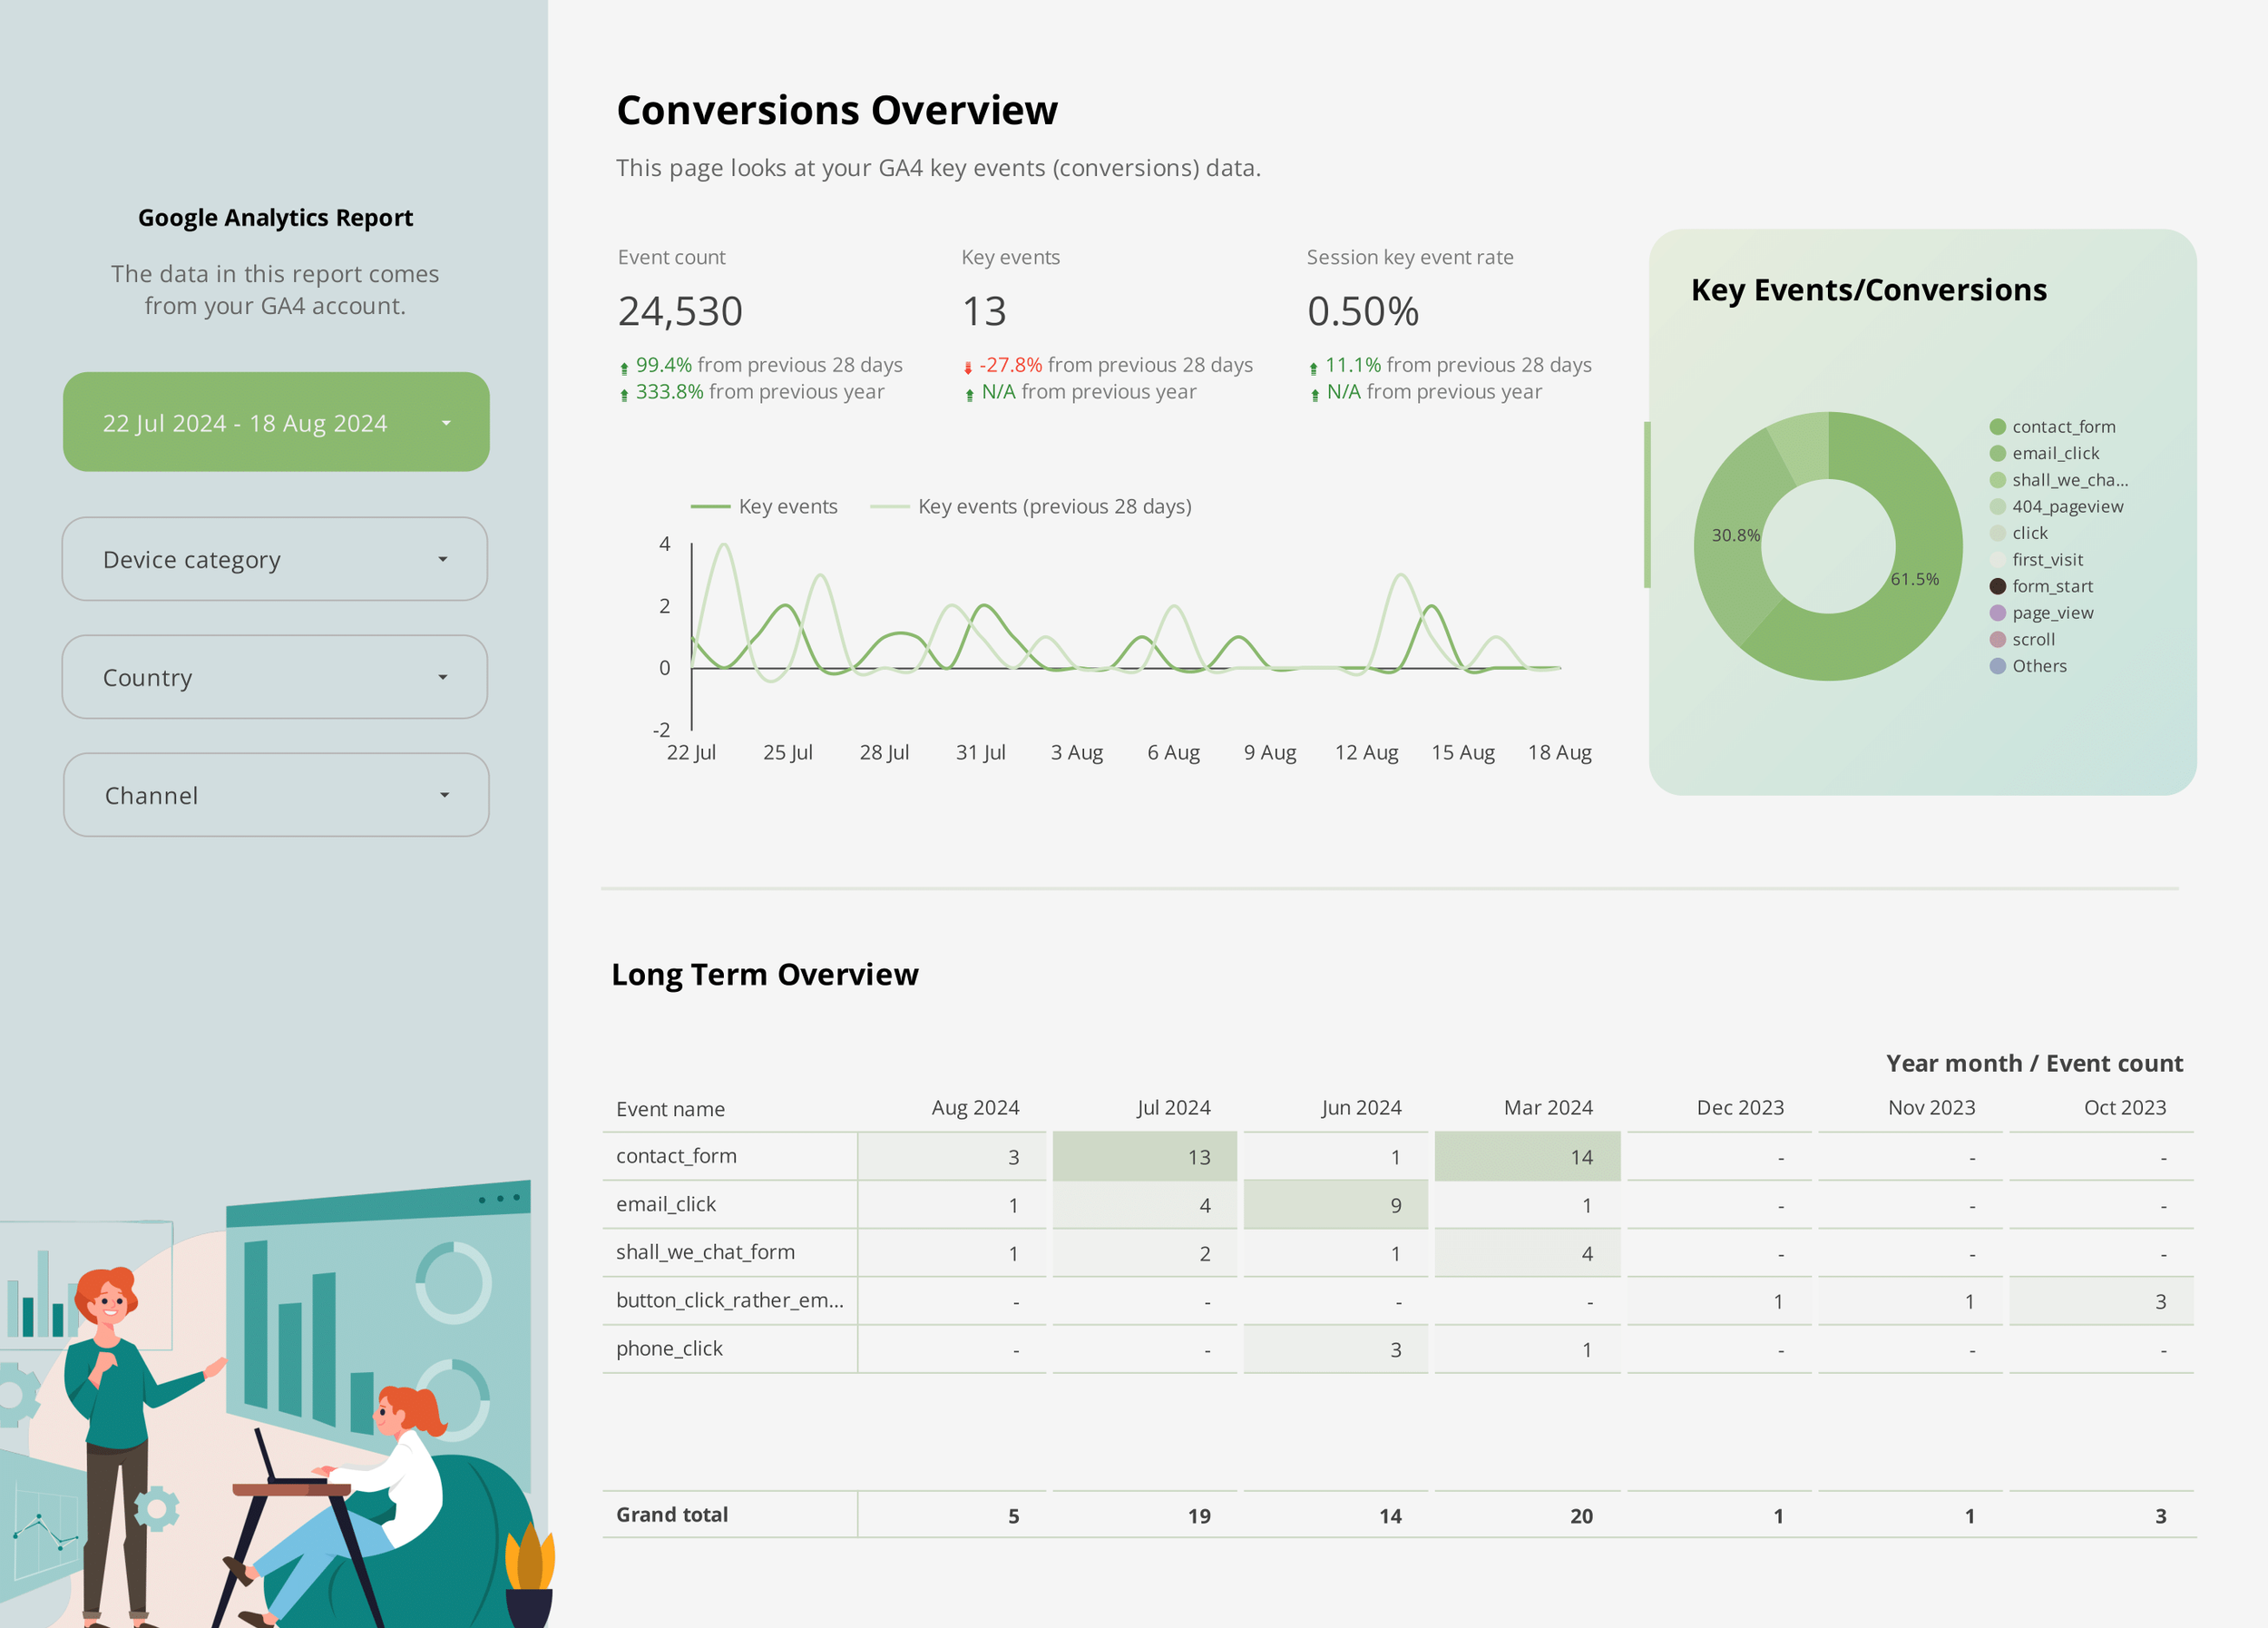
Analyze page views, event counts, and user interactions across your site, allowing you to see which content is performing well and where improvements can be made.
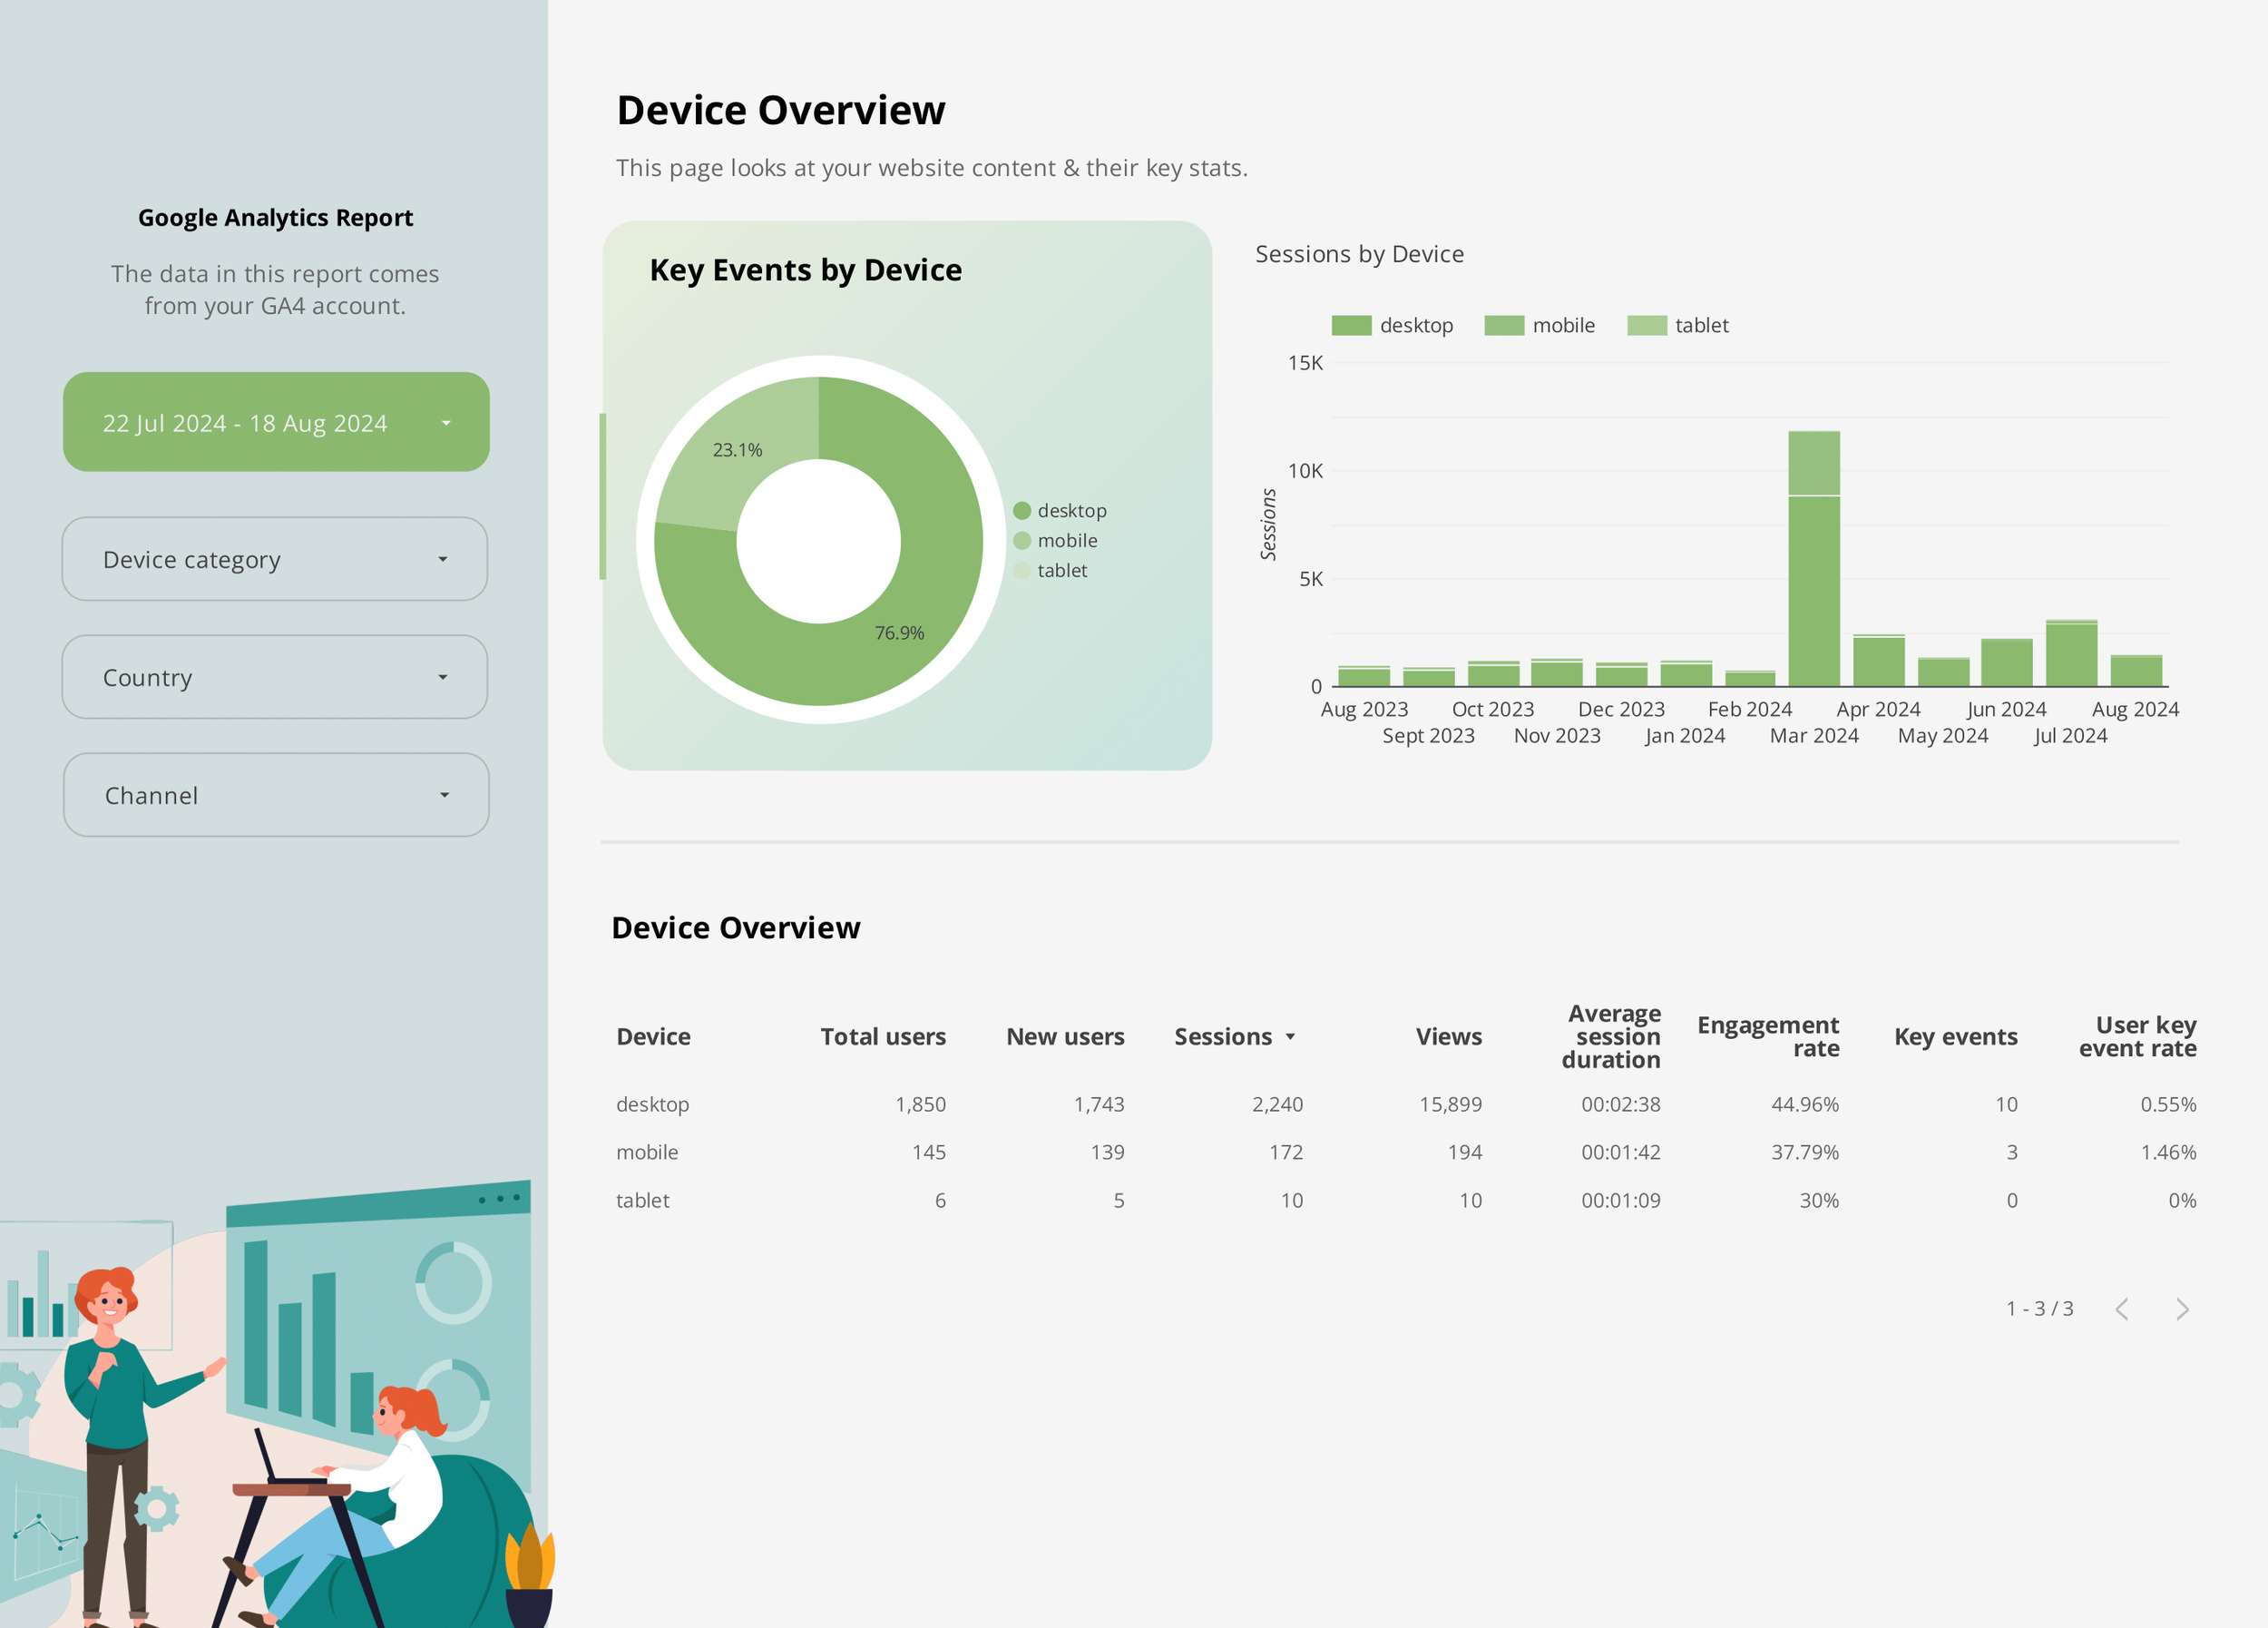
Who is visiting my site?
Get demographic insights into your audience, including user location and device usage, to better tailor your marketing efforts and content strategy.
How does my website perform over time?
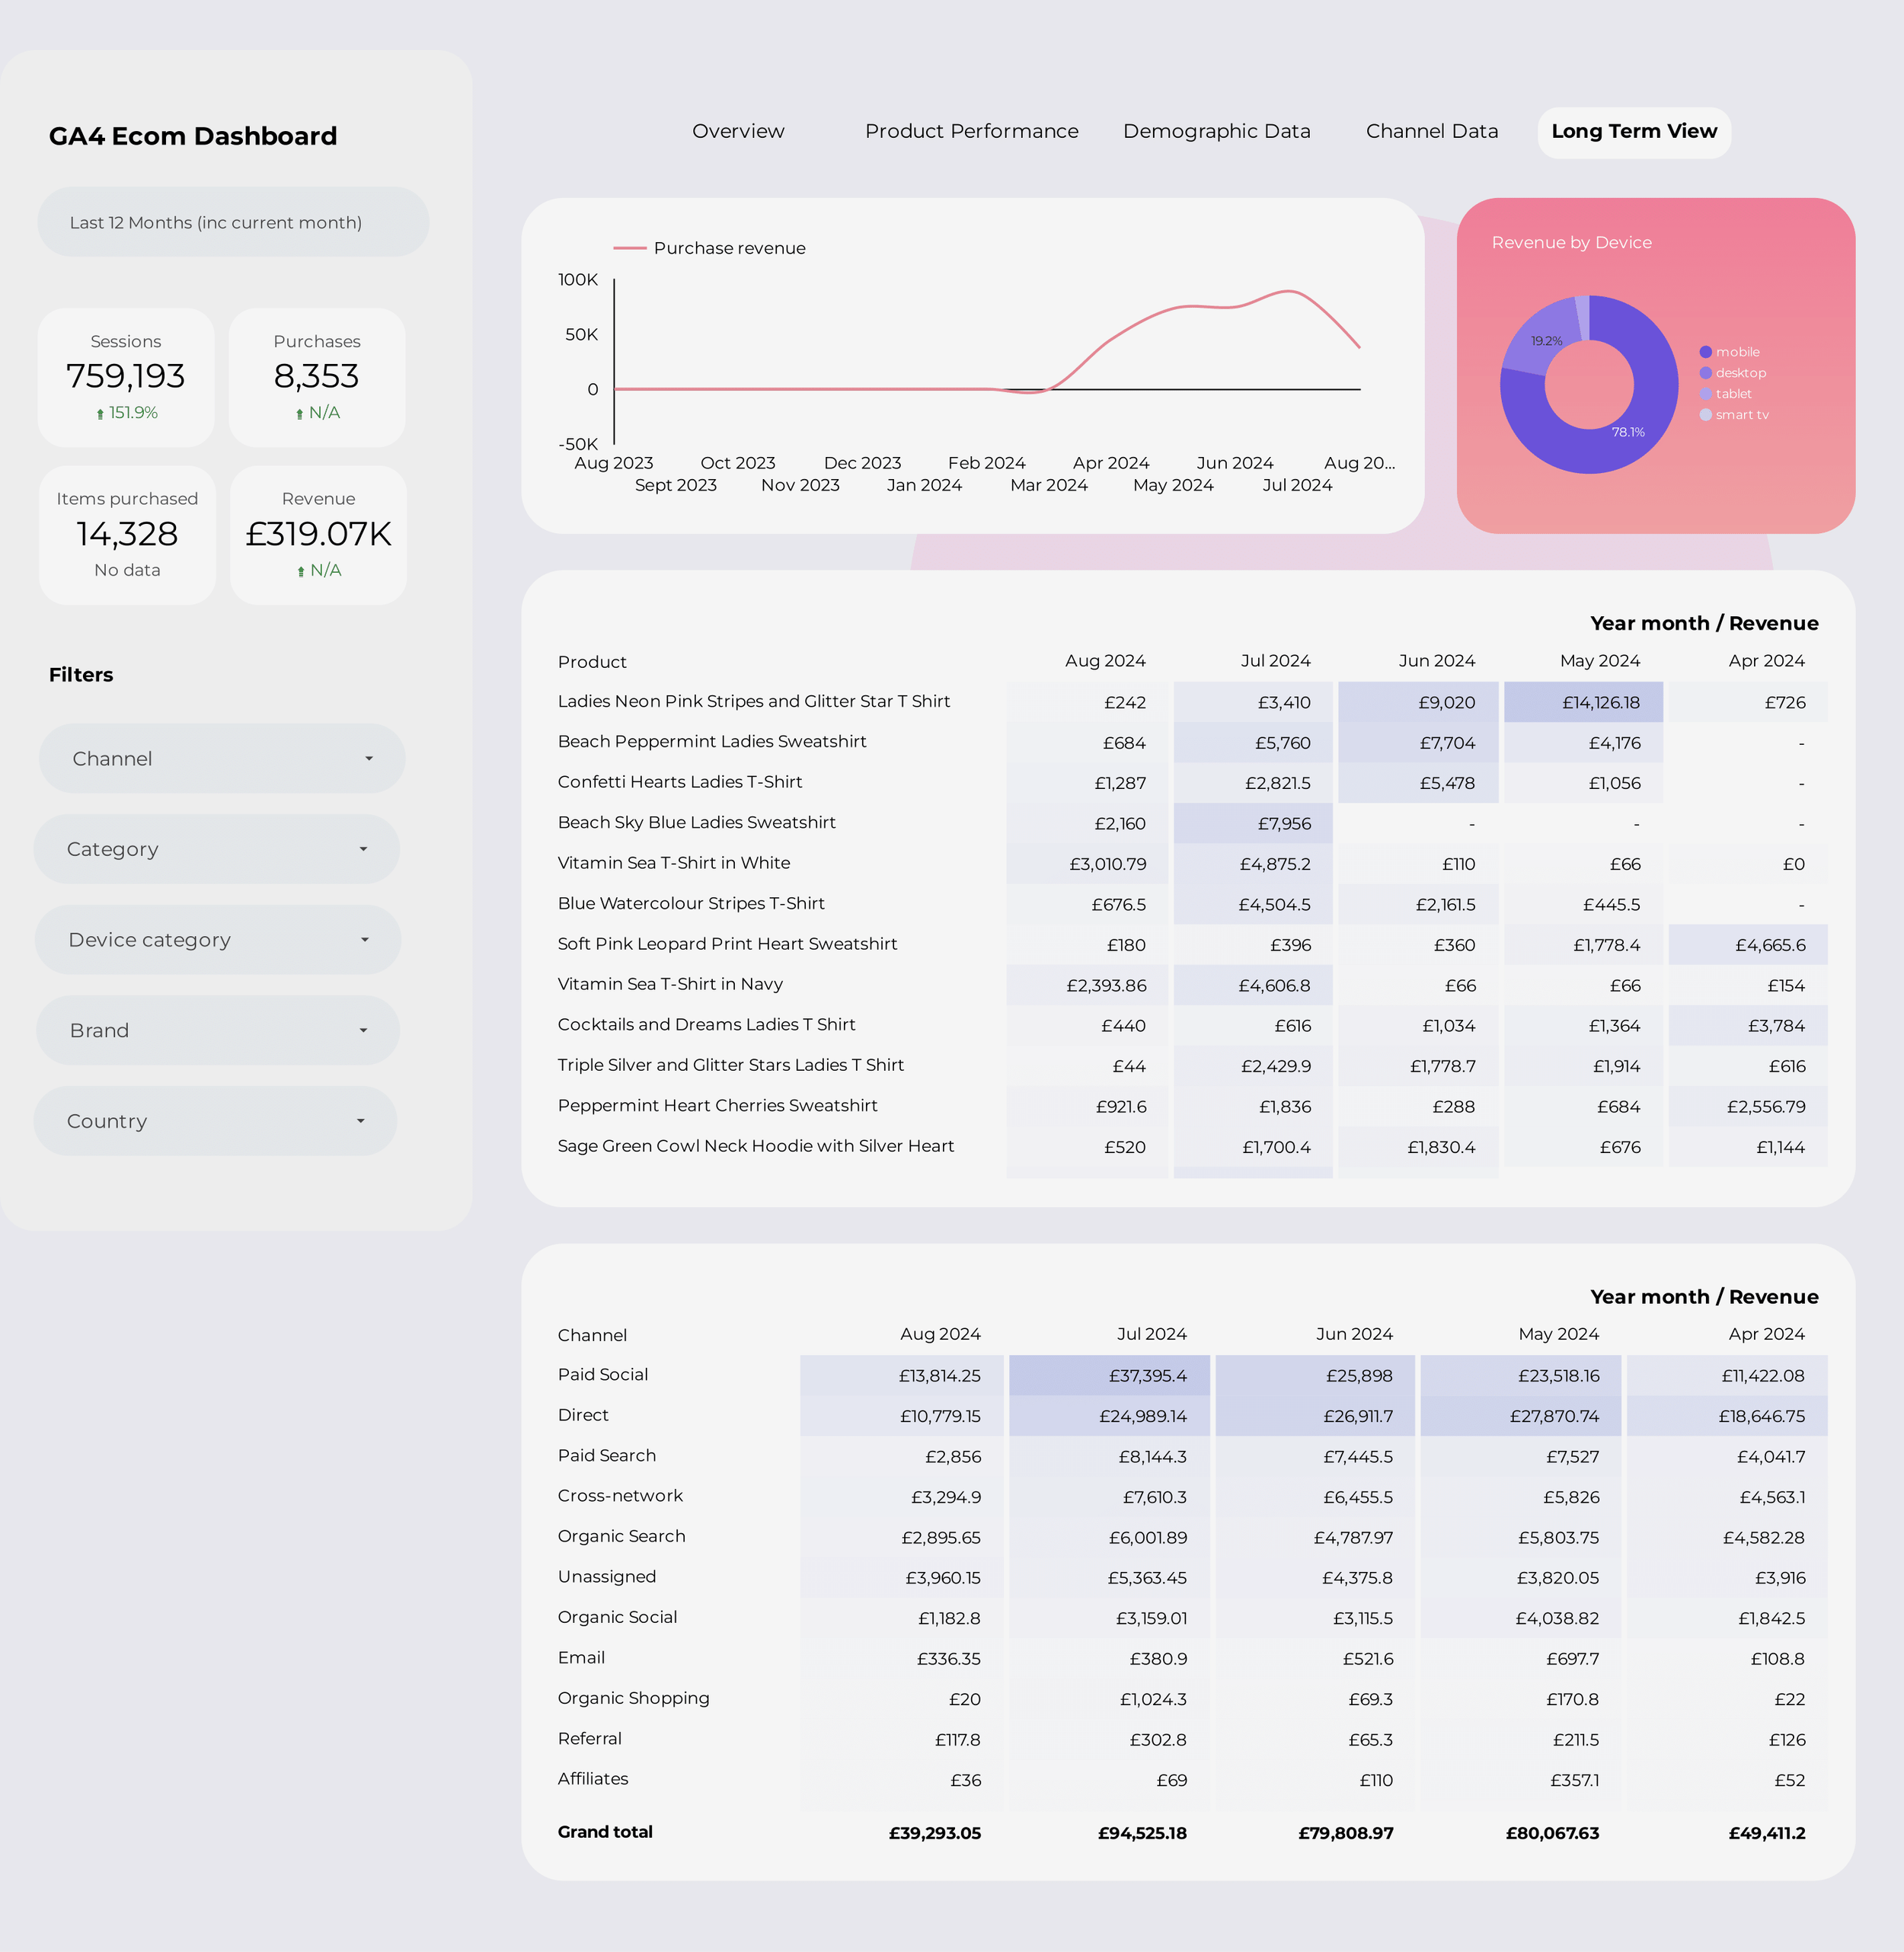
Track performance trends over the last 12 months, with data visualizations that make it easy to spot changes and understand long-term patterns.
Key Features
High-Level Metrics: Provides a simplified view of the most important metrics, making it easy for clients to understand their website’s performance at a glance.
Customizable Filters: Allows users to filter data by channel, country, device, and more, offering flexibility in how you present the data.
Clear Visualizations: Includes pie charts, bar graphs, and trend lines that clearly display your GA4 data, making it accessible for users with any level of analytics experience.
Client-Friendly Reporting: Perfect for agencies and freelancers who need to provide clients with insights without the complexity of the full GA4 interface.
How It Works
Purchase the Template
Buy the template from our store. After your purchase is complete, you’ll receive a confirmation email with a PDF document attached.
Receive a PDF Guide
The PDF guide includes detailed instructions and a link to the Looker Studio report. This guide will walk you through the process of accessing the report and making a copy for your own use.
Access the Looker Studio Report
Use the link provided in the PDF to access the Looker Studio report. Once you’re on the Looker Studio platform, you can follow the instructions to make a copy of the report.
Set Up Your Data Sources
After making a copy, follow the PDF instructions to connect your accounts to the report. This setup ensures your data is accurately reflected in the dashboard.
Customize and Share
Once your data sources are connected, you can customize the report to suit your specific needs.


