 Image 1 of 4

 Image 2 of 4

 Image 3 of 4

 Image 4 of 4


Index Performance Calculator - SEO Report
View Live Demo
Note: This report uses data from Google Search Console and Google Analytics 4.
The Index Performance Calculator is a unique and powerful tool designed to assess the effectiveness of your website's content. Unlike anything else available in Looker Studio, this report provides deep insights into the performance of every page on your site, helping you identify underperforming content and areas ripe for optimization.
About This Template
Purchasing this template grants you access to make a copy of the report in your own Looker Studio. By purchasing this template, you agree to our Template Usage Agreement.
What Questions Does This Report Answer?
How effective is my website content?
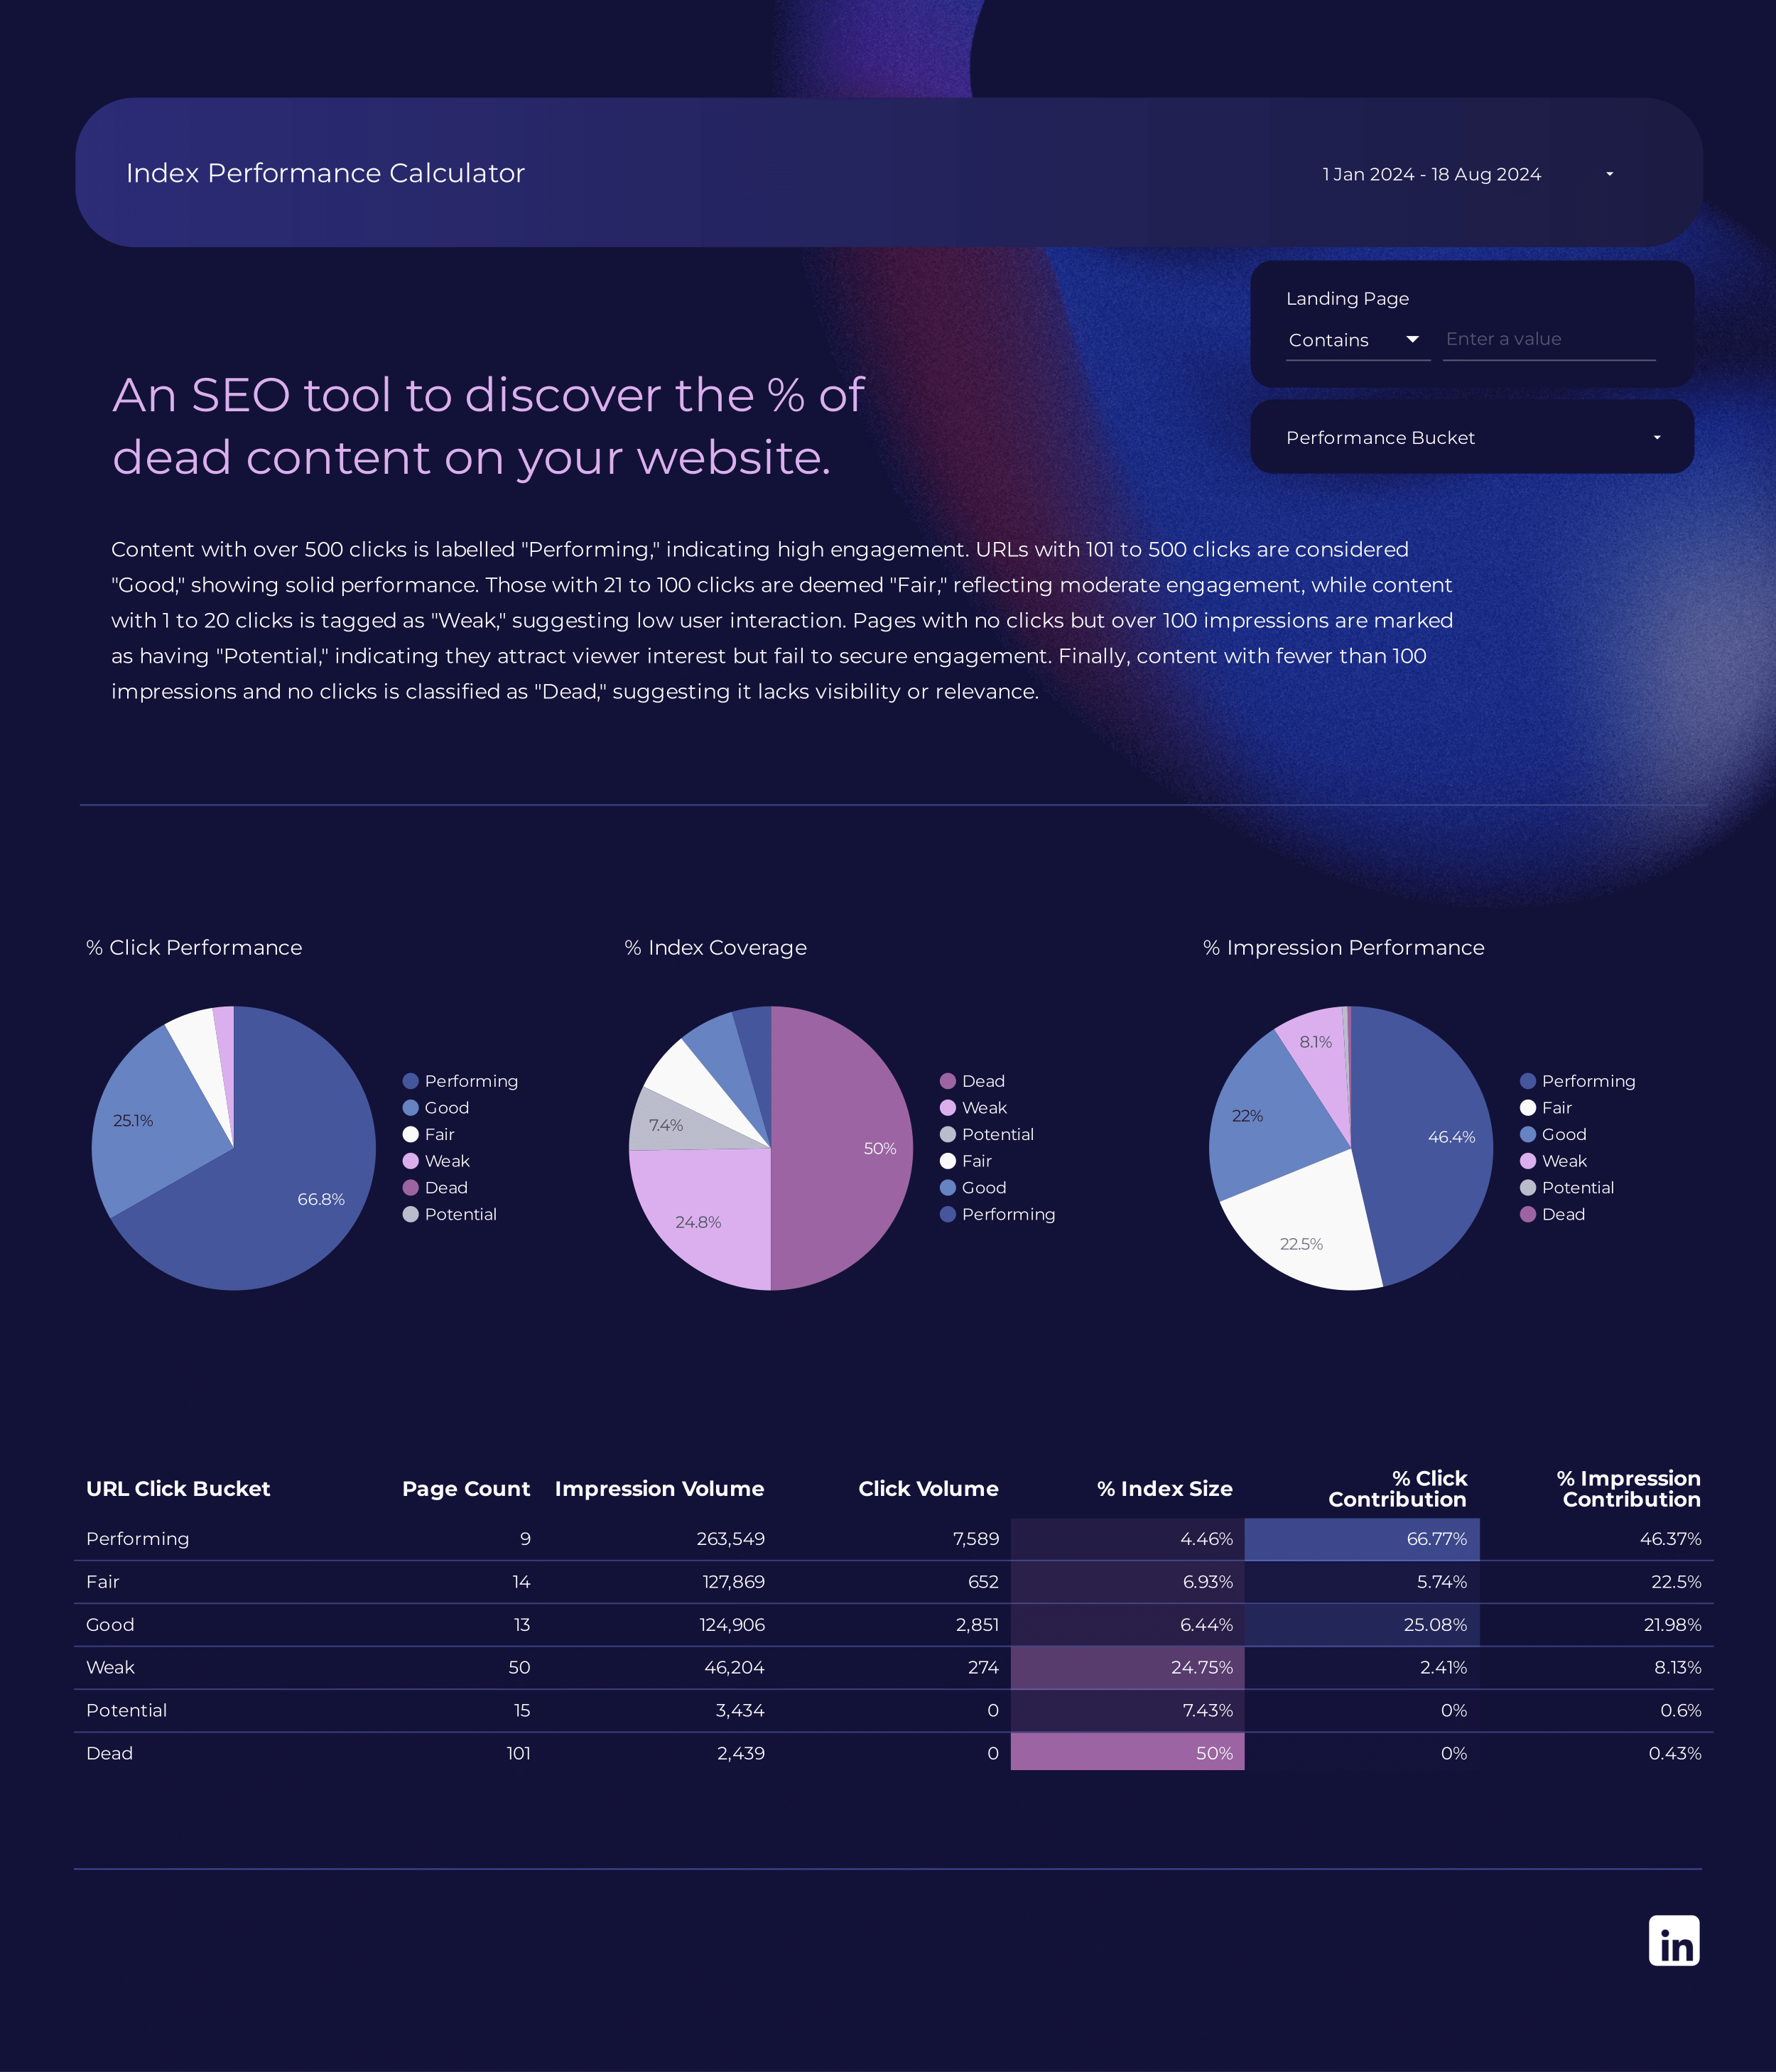
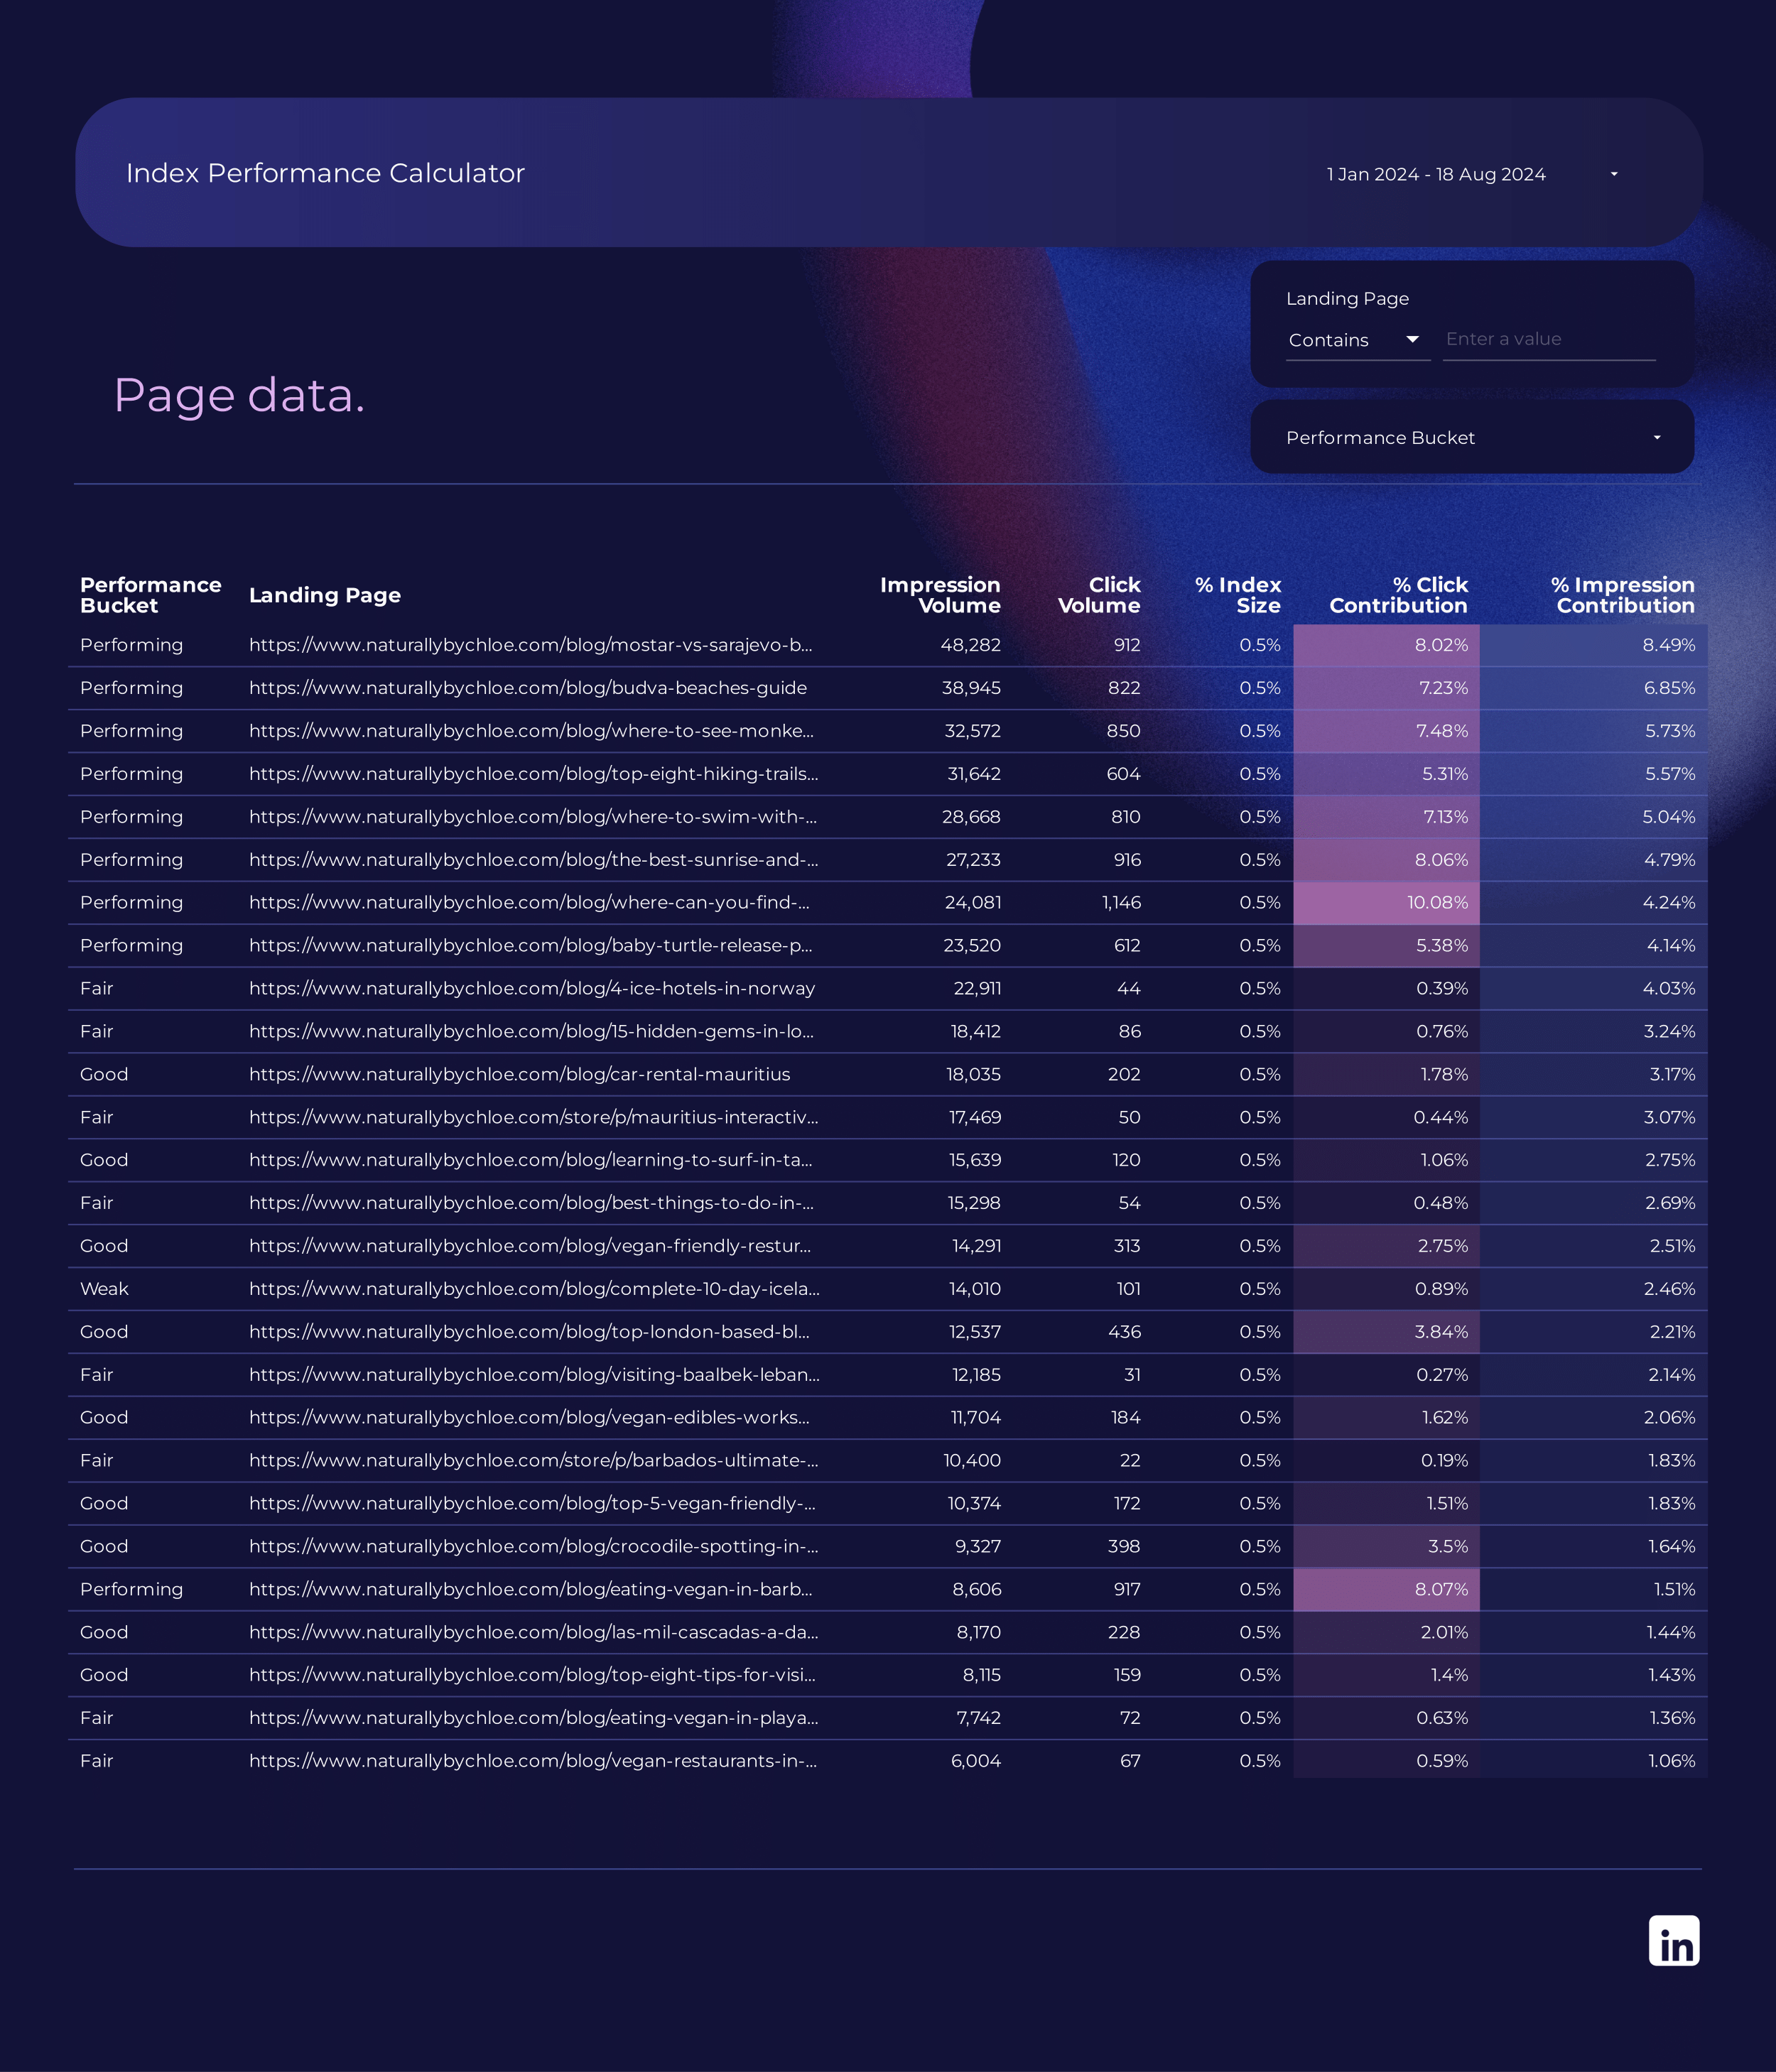
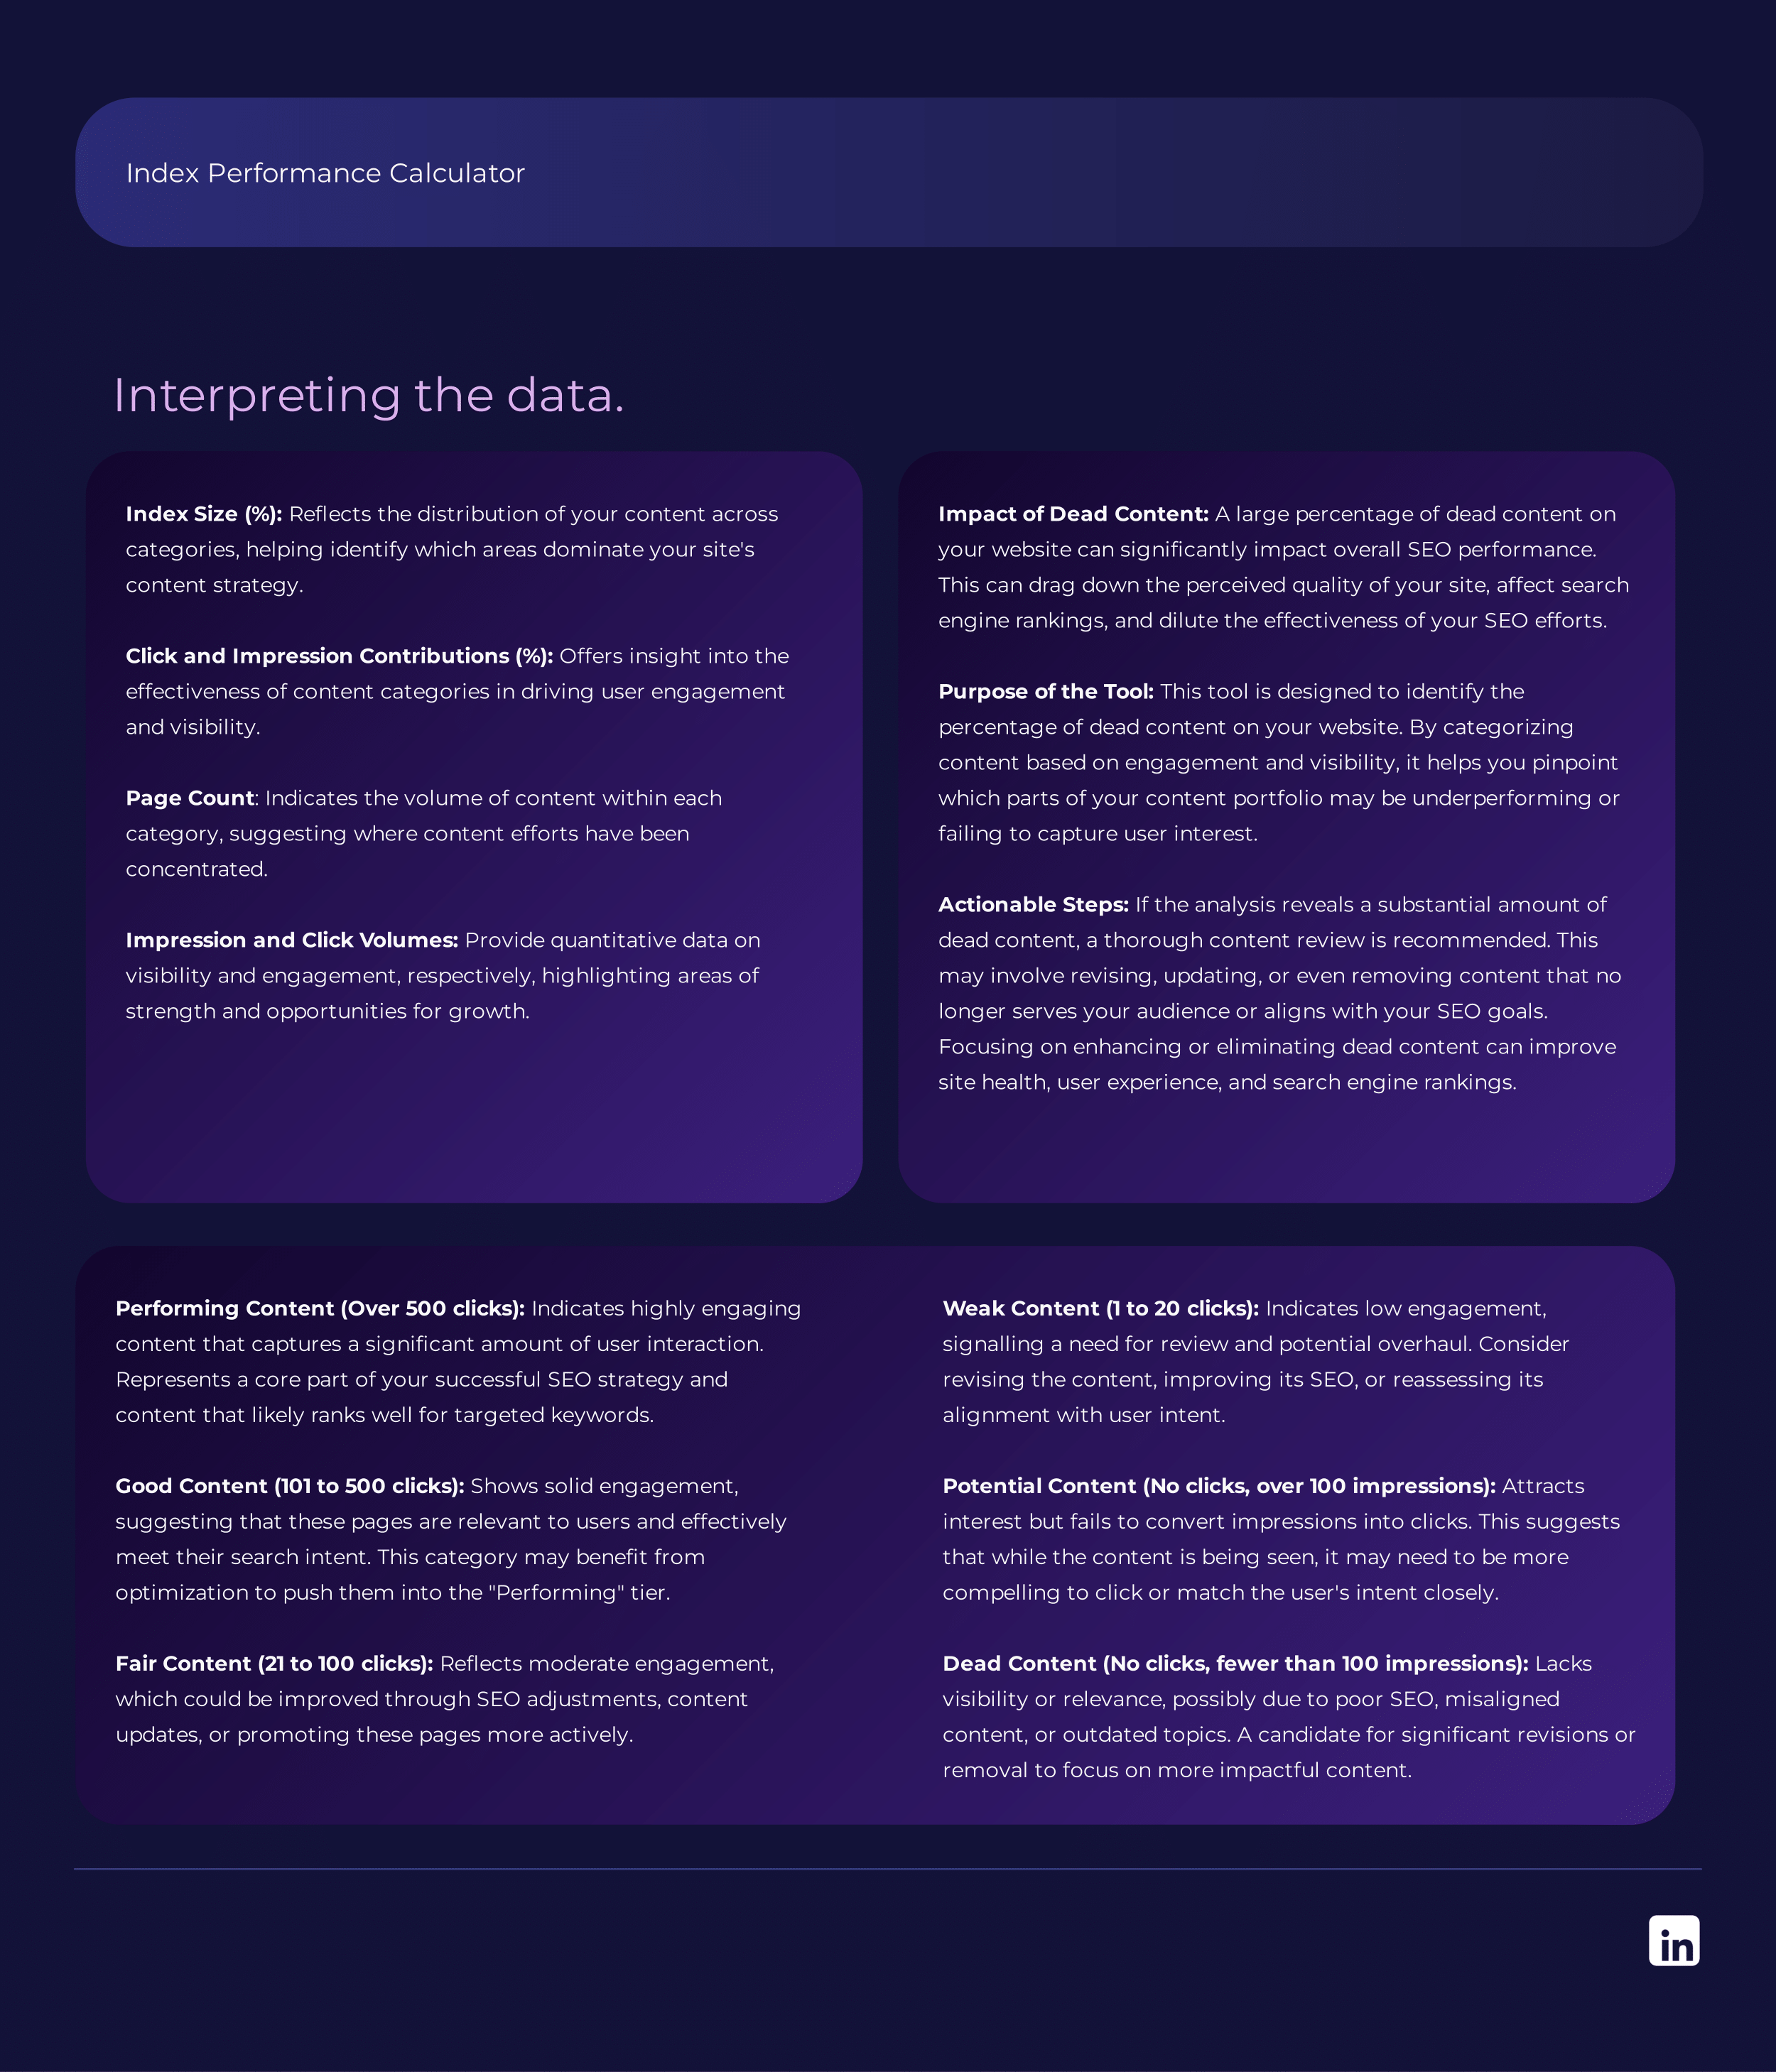
This tool categorizes your content into performance buckets (Performing, Good, Fair, Weak, Potential, Dead) based on clicks and impressions, giving you a clear view of what content is driving traffic and what isn't.
What percentage of my content is 'dead'?
Discover the percentage of your website's content that is not generating clicks or impressions, potentially dragging down your overall SEO performance.
Which content should I focus on improving?
Identify "Potential" and "Weak" content—pages that attract impressions but fail to convert them into clicks, offering opportunities for optimization.
How does my content contribute to overall site performance?
Analyze the click and impression contributions of each content category to understand where your efforts are paying off and where adjustments are needed.
Are there discrepancies between my GSC and GA4 data?
This report also compares GSC clicks with GA4 organic sessions, highlighting any potential tracking issues that may need to be addressed.
Key Features
Performance Categorization: Automatically categorizes your content into six distinct buckets, from "Performing" to "Dead," based on engagement metrics, so you know exactly where to focus your efforts.
Content Impact Analysis: Provides insights into how different content categories contribute to your site's overall performance in terms of clicks and impressions.
Dead Content Identification: Helps you identify content that is no longer serving its purpose, allowing you to clean up or repurpose content to enhance your site's SEO health.
GSC vs. GA4 Data Comparison: Offers a comparison between your Google Search Console and Google Analytics 4 data to detect any inconsistencies in tracking.
How It Works
Purchase the Template
Buy the template from our store. After your purchase is complete, you’ll receive a confirmation email with a PDF document attached.
Receive a PDF Guide
The PDF guide includes detailed instructions and a link to the Looker Studio report. This guide will walk you through the process of accessing the report and making a copy for your own use.
Access the Looker Studio Report
Use the link provided in the PDF to access the Looker Studio report. Once you’re on the Looker Studio platform, you can follow the instructions to make a copy of the report.
Set Up Your Data Sources
After making a copy, follow the PDF instructions to connect your accounts to the report. This setup ensures your data is accurately reflected in the dashboard.
Customize and Share
Once your data sources are connected, you can customize the report to suit your specific needs.


