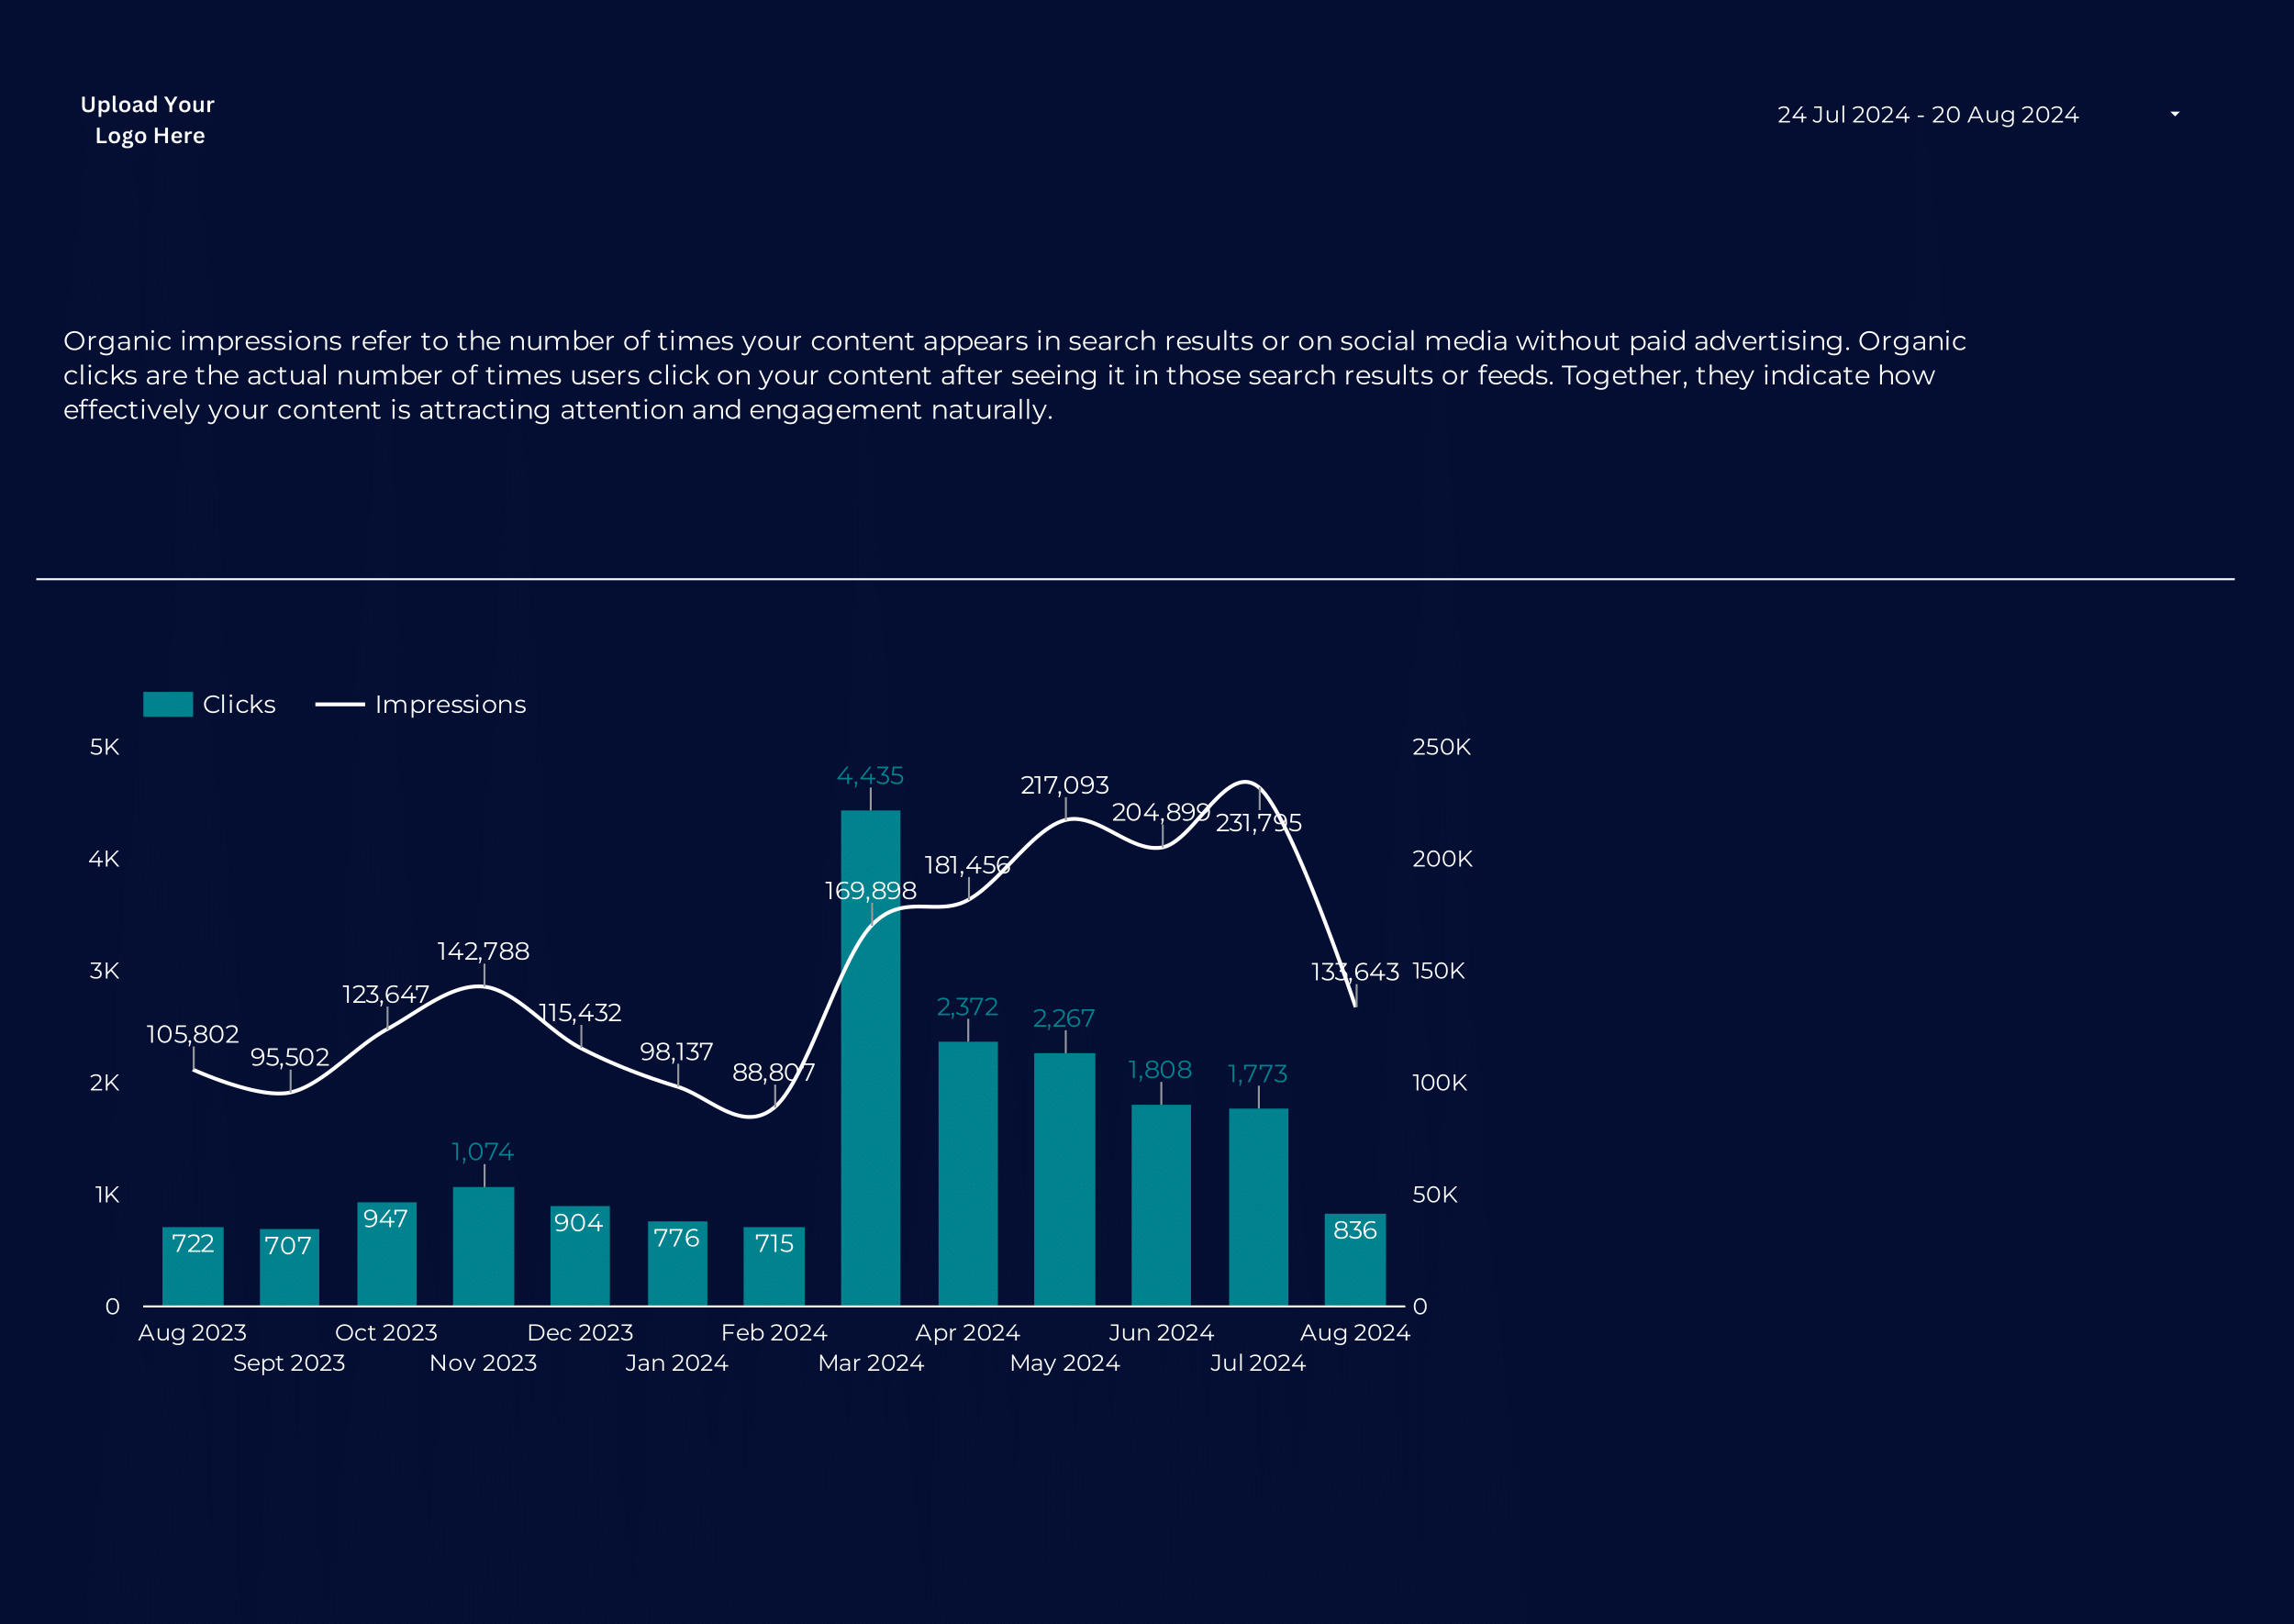
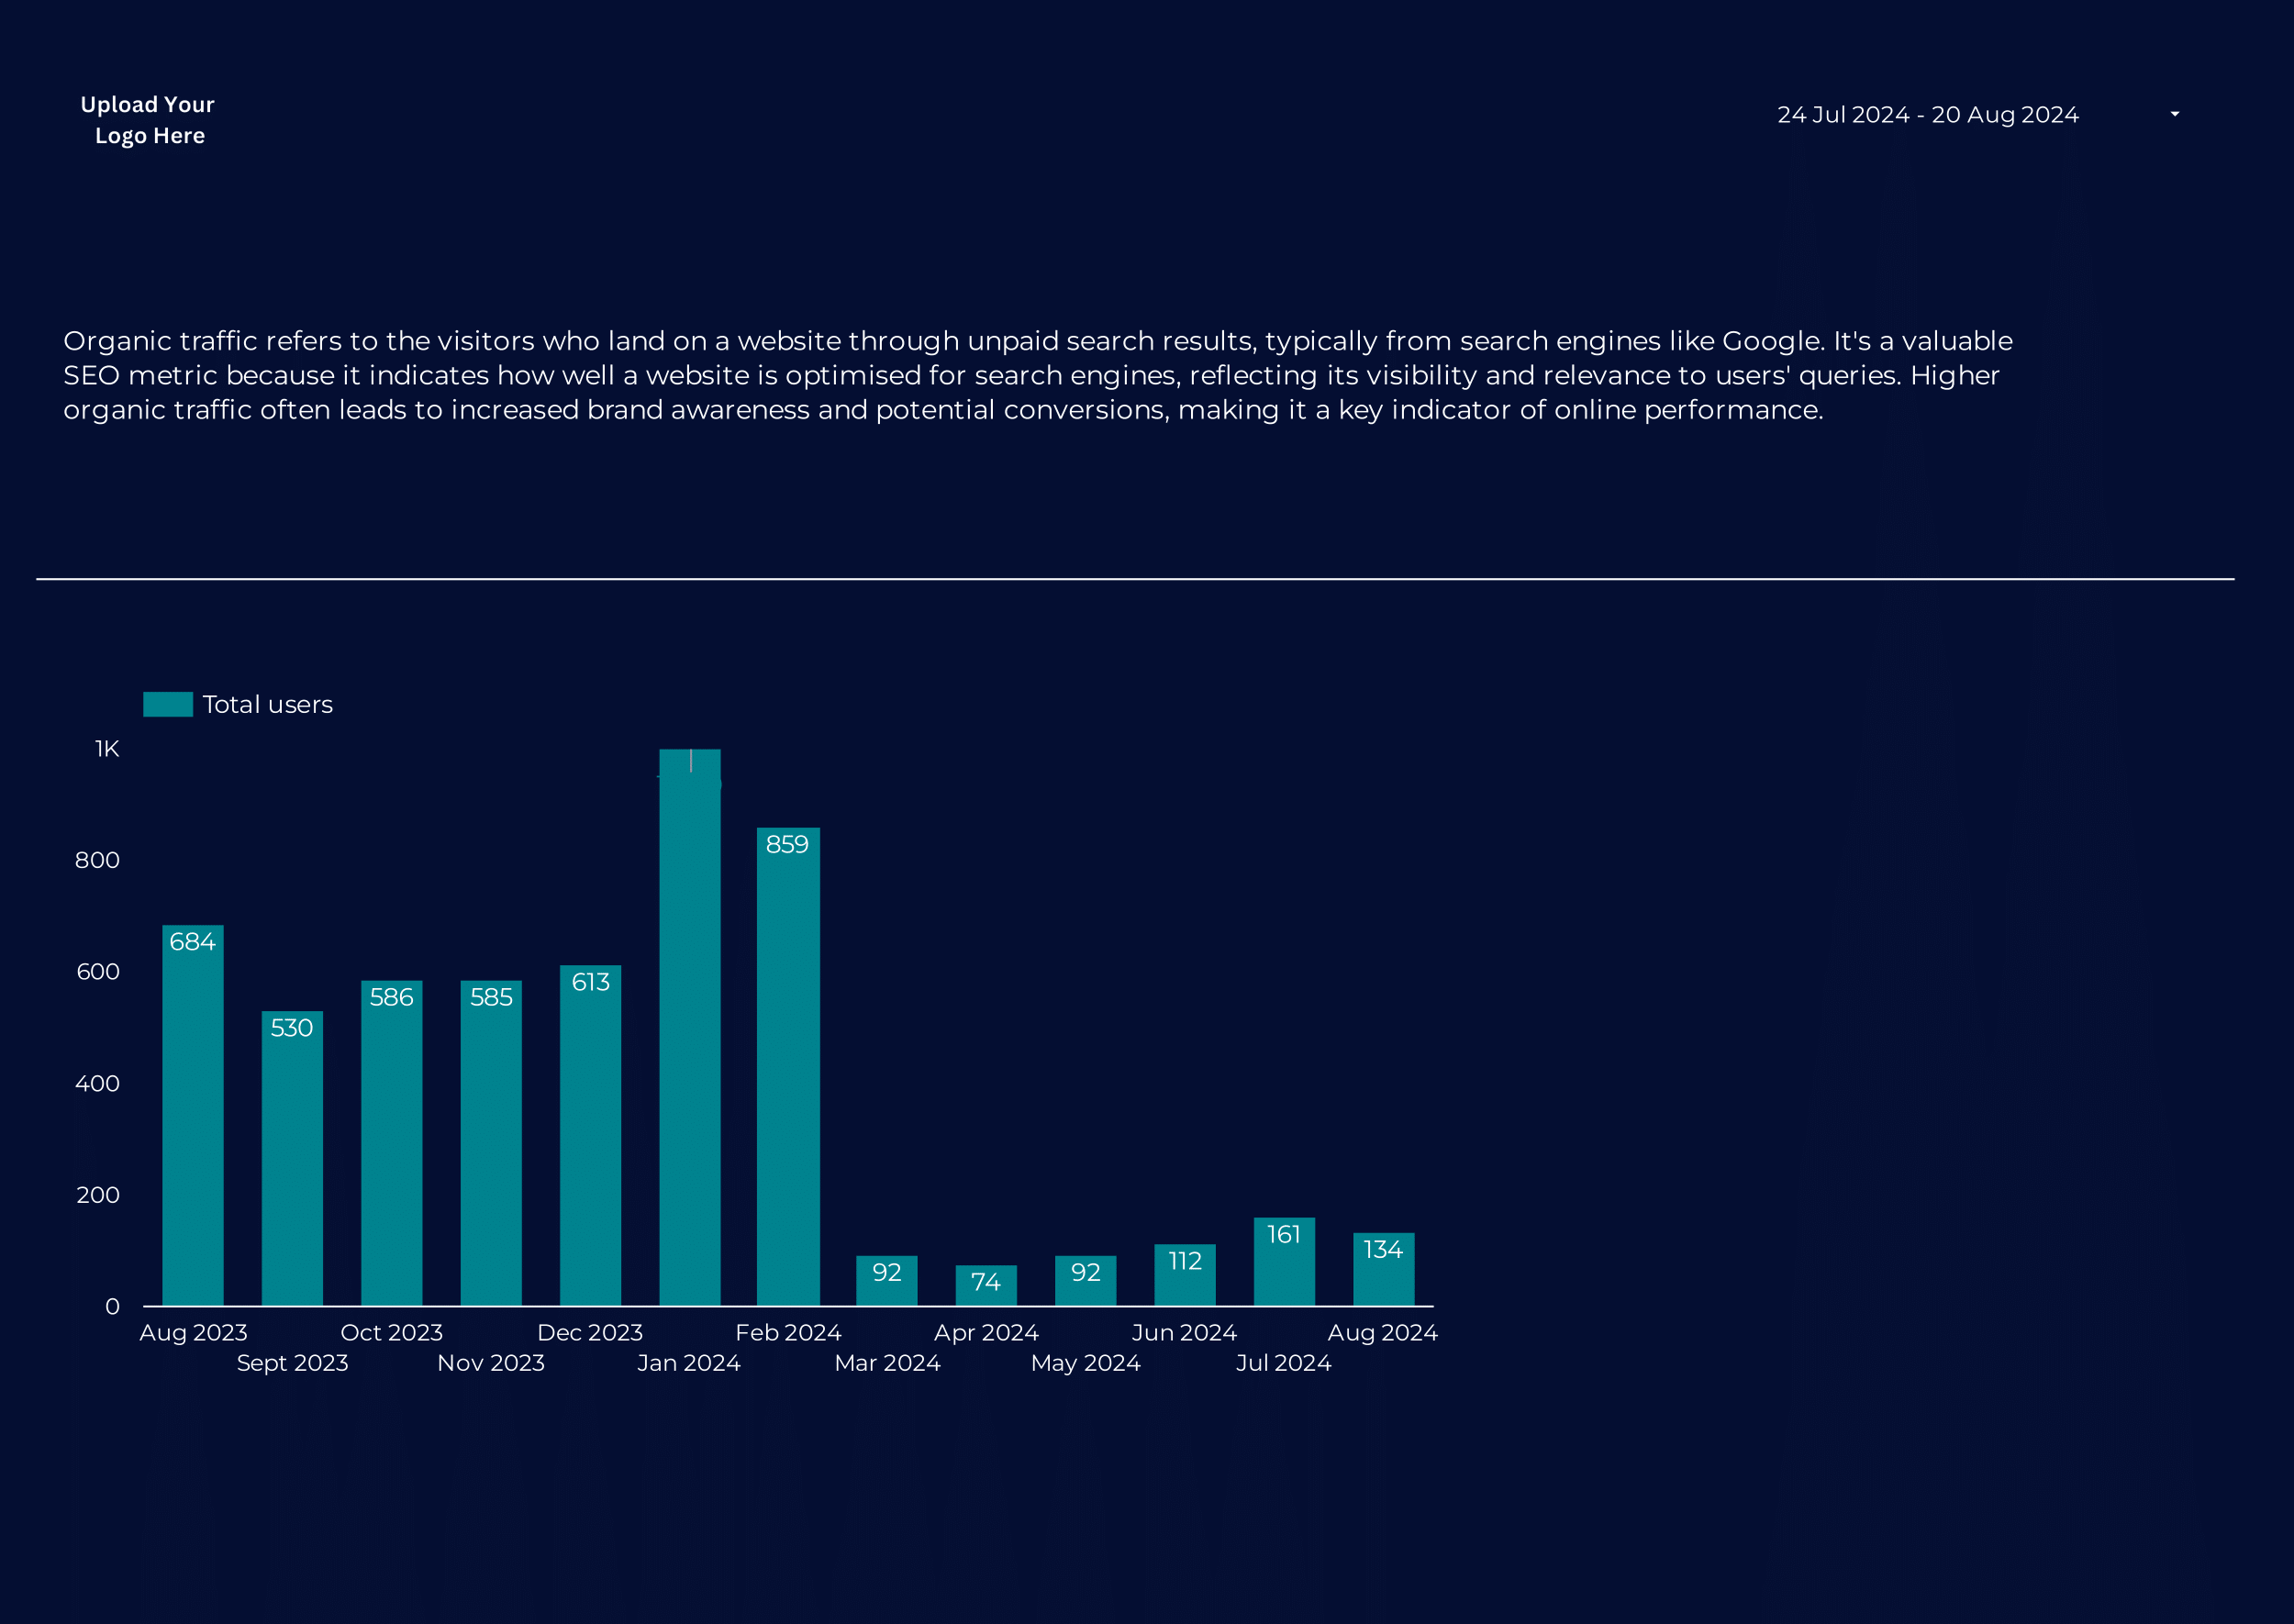
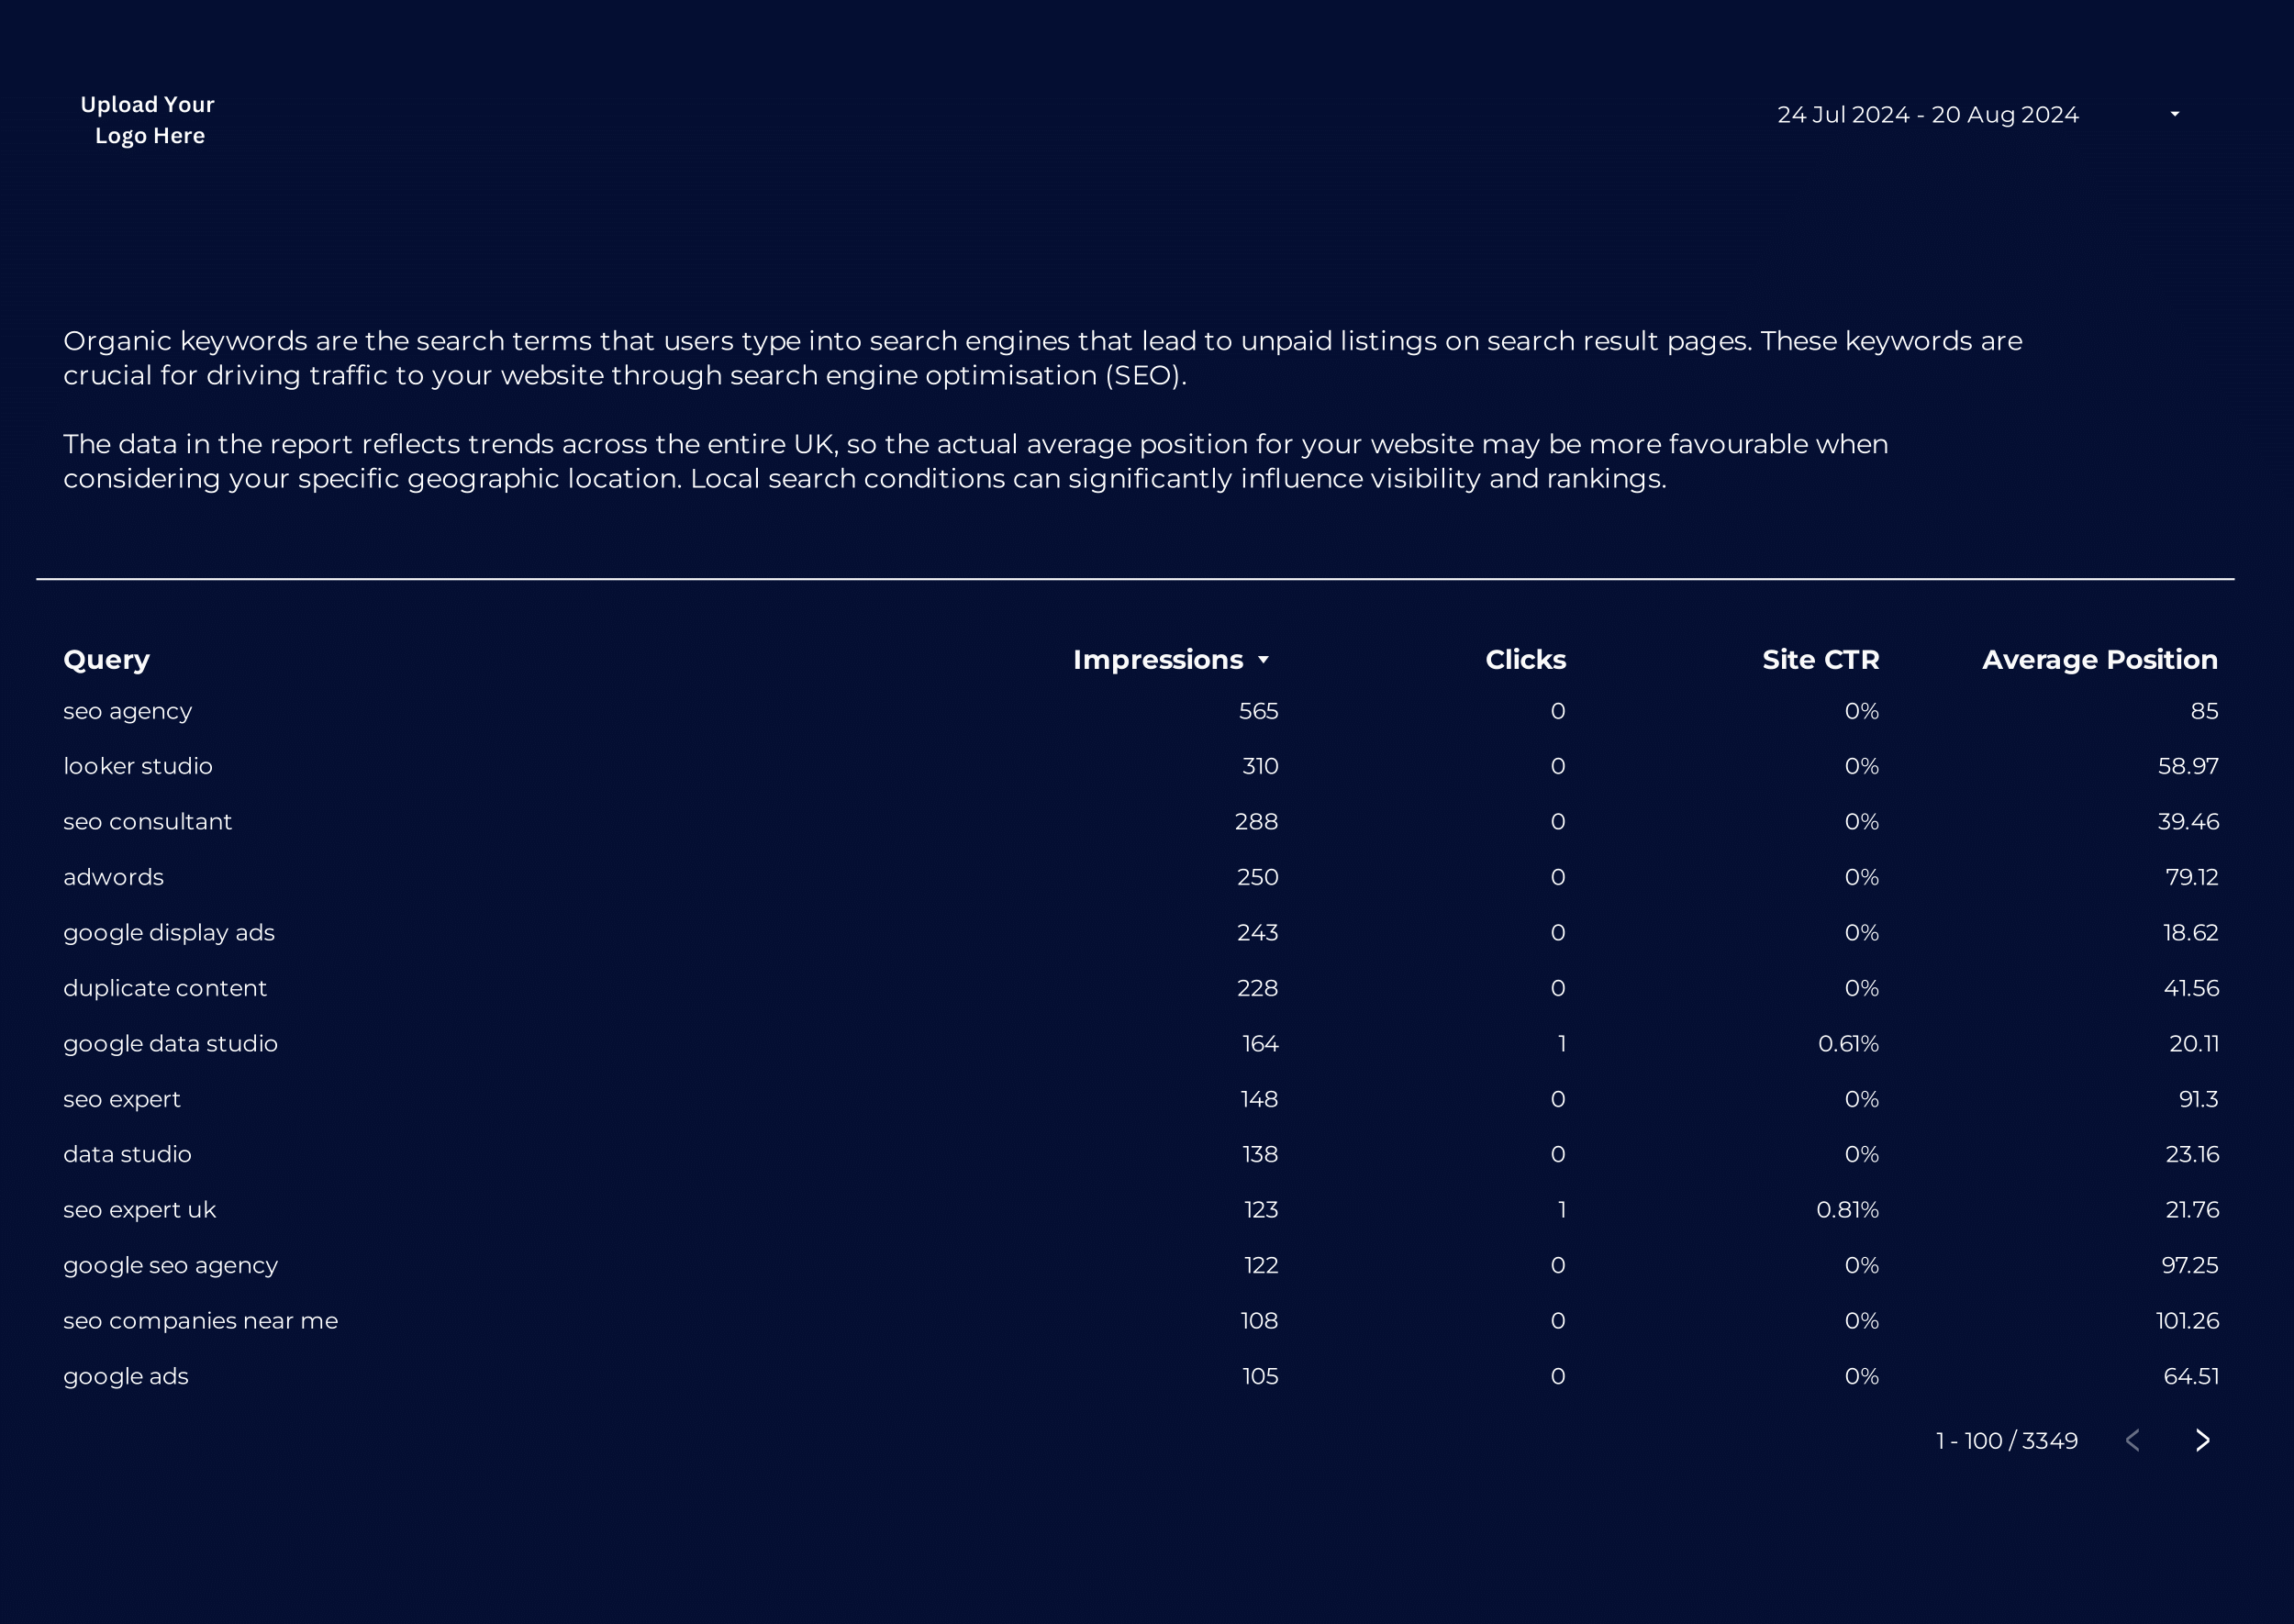
 Image 1 of 2

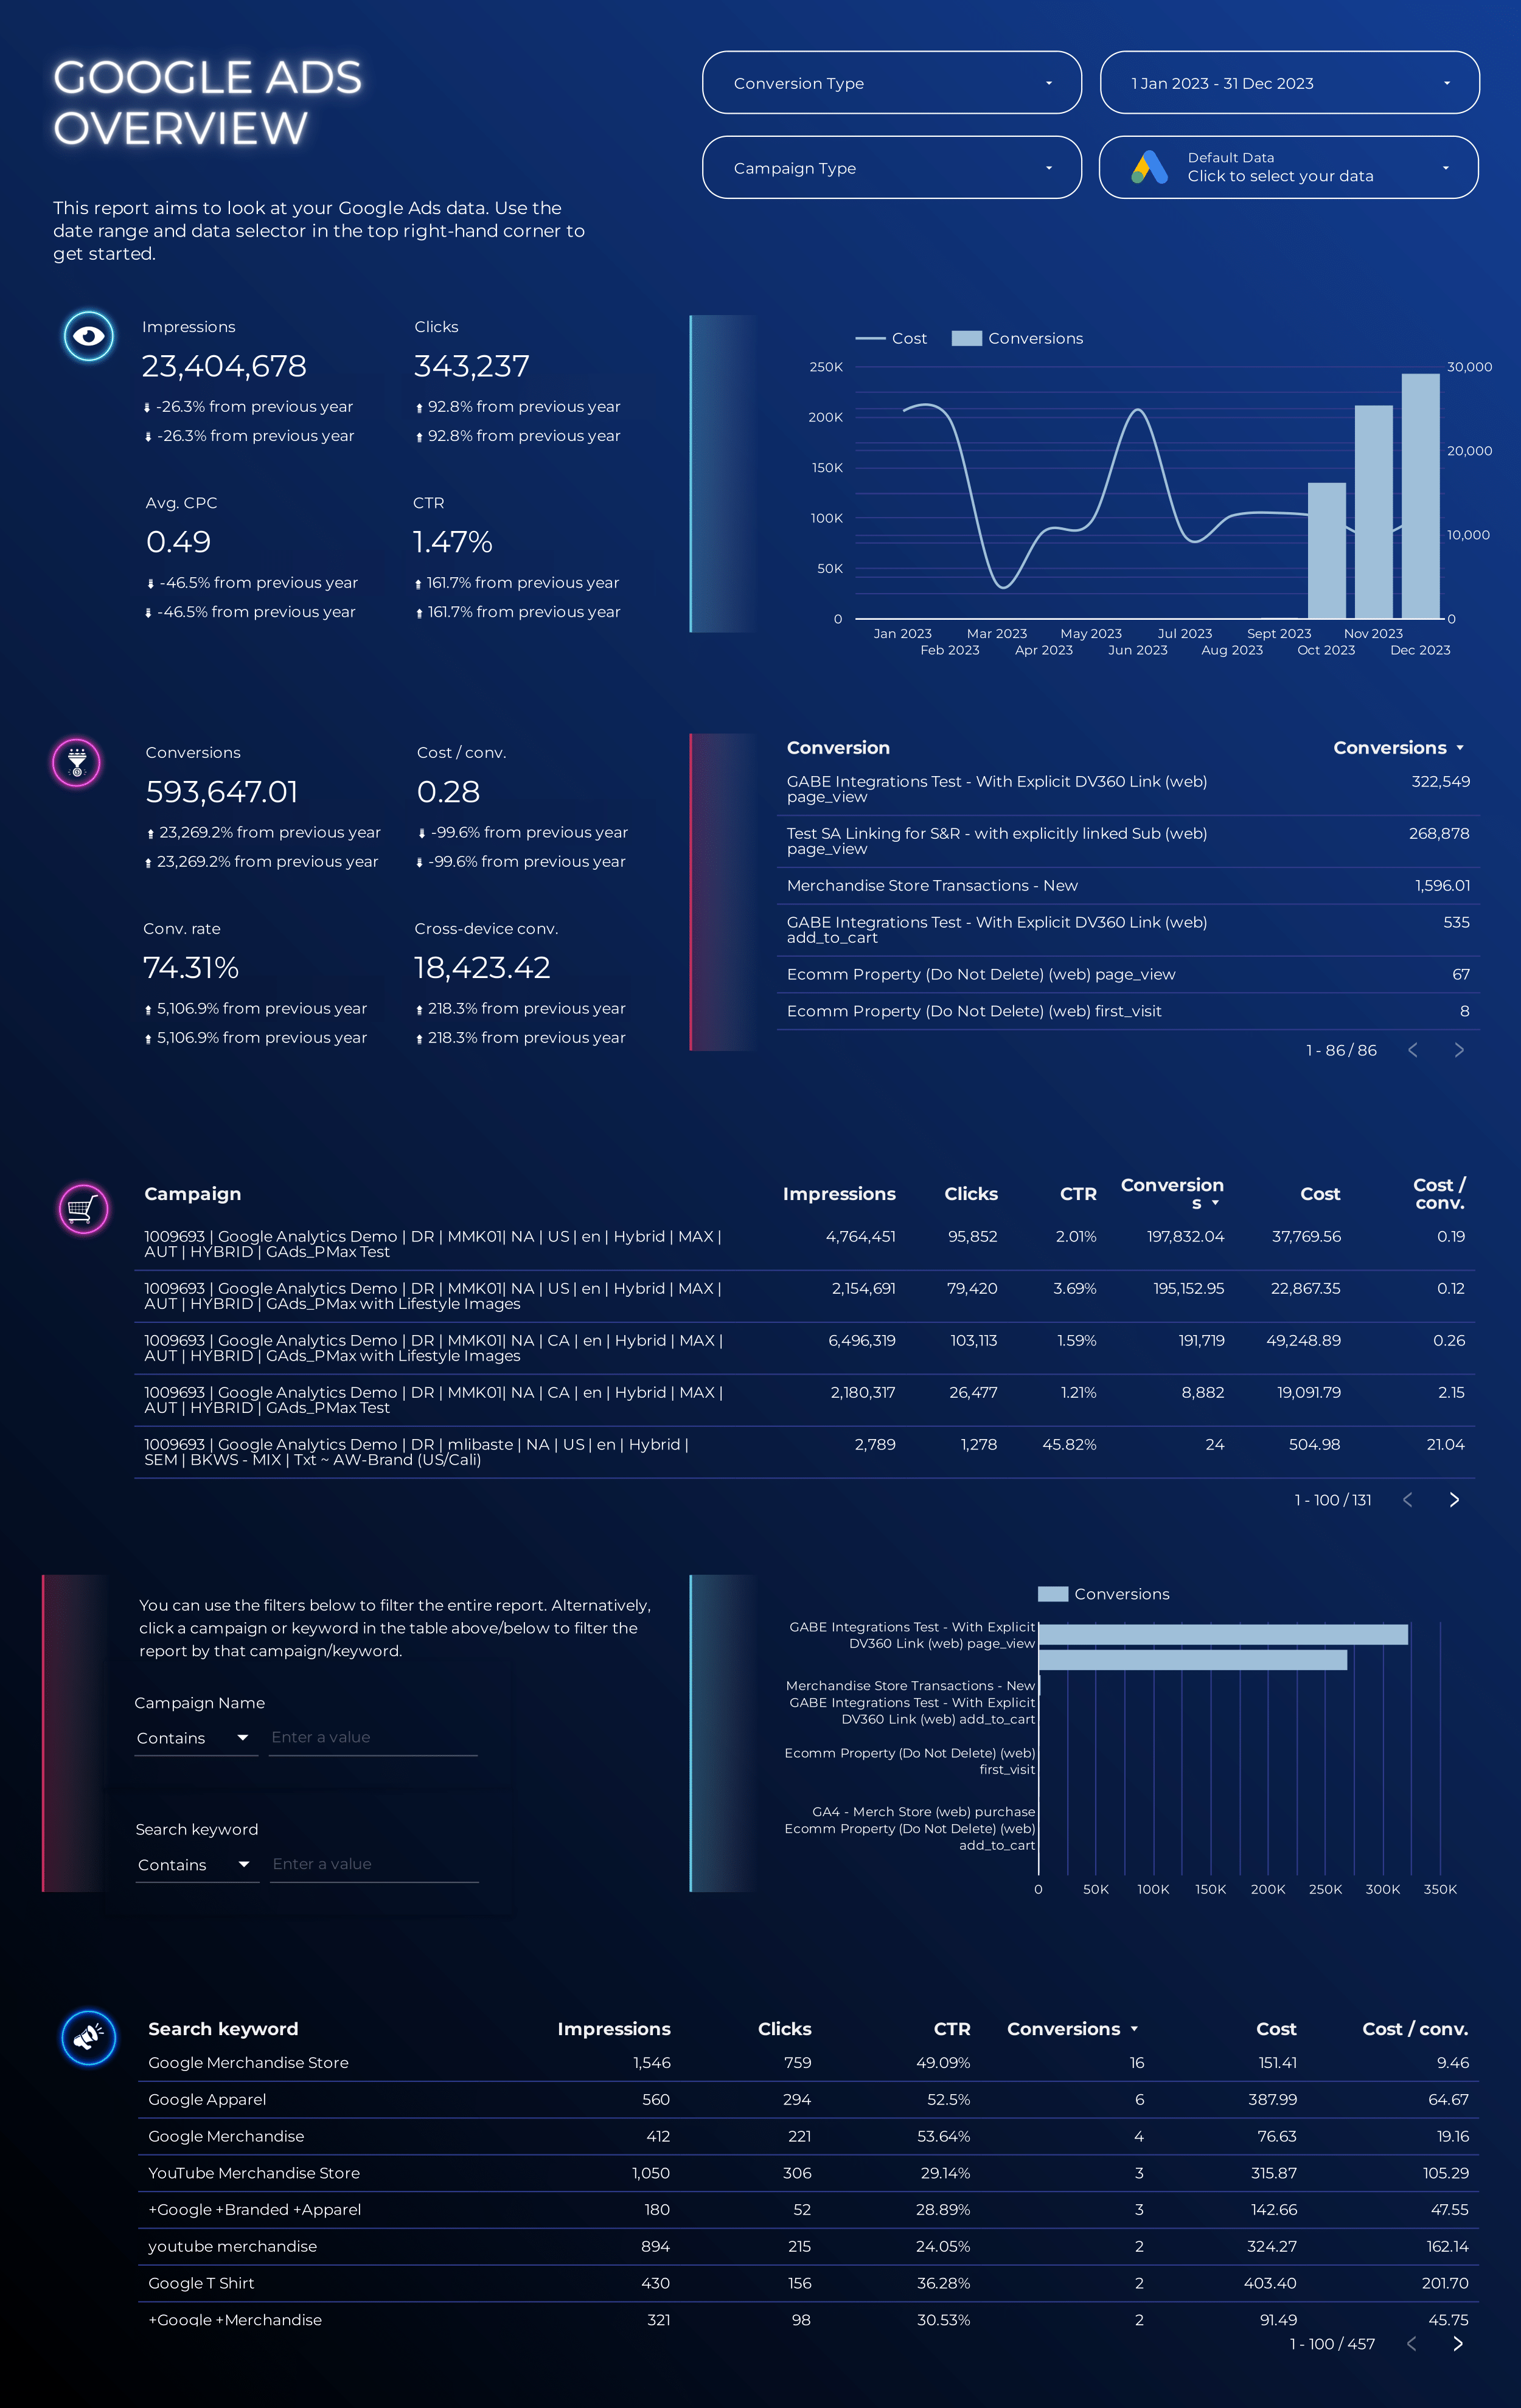 Image 2 of 2


Simple Google Ads Dashboard (Ecom & Lead Gen)
View Live Demo
Note: This report uses data from your Google Ads account.
A Simple Yet Effective Overview of Your Google Ads Performance
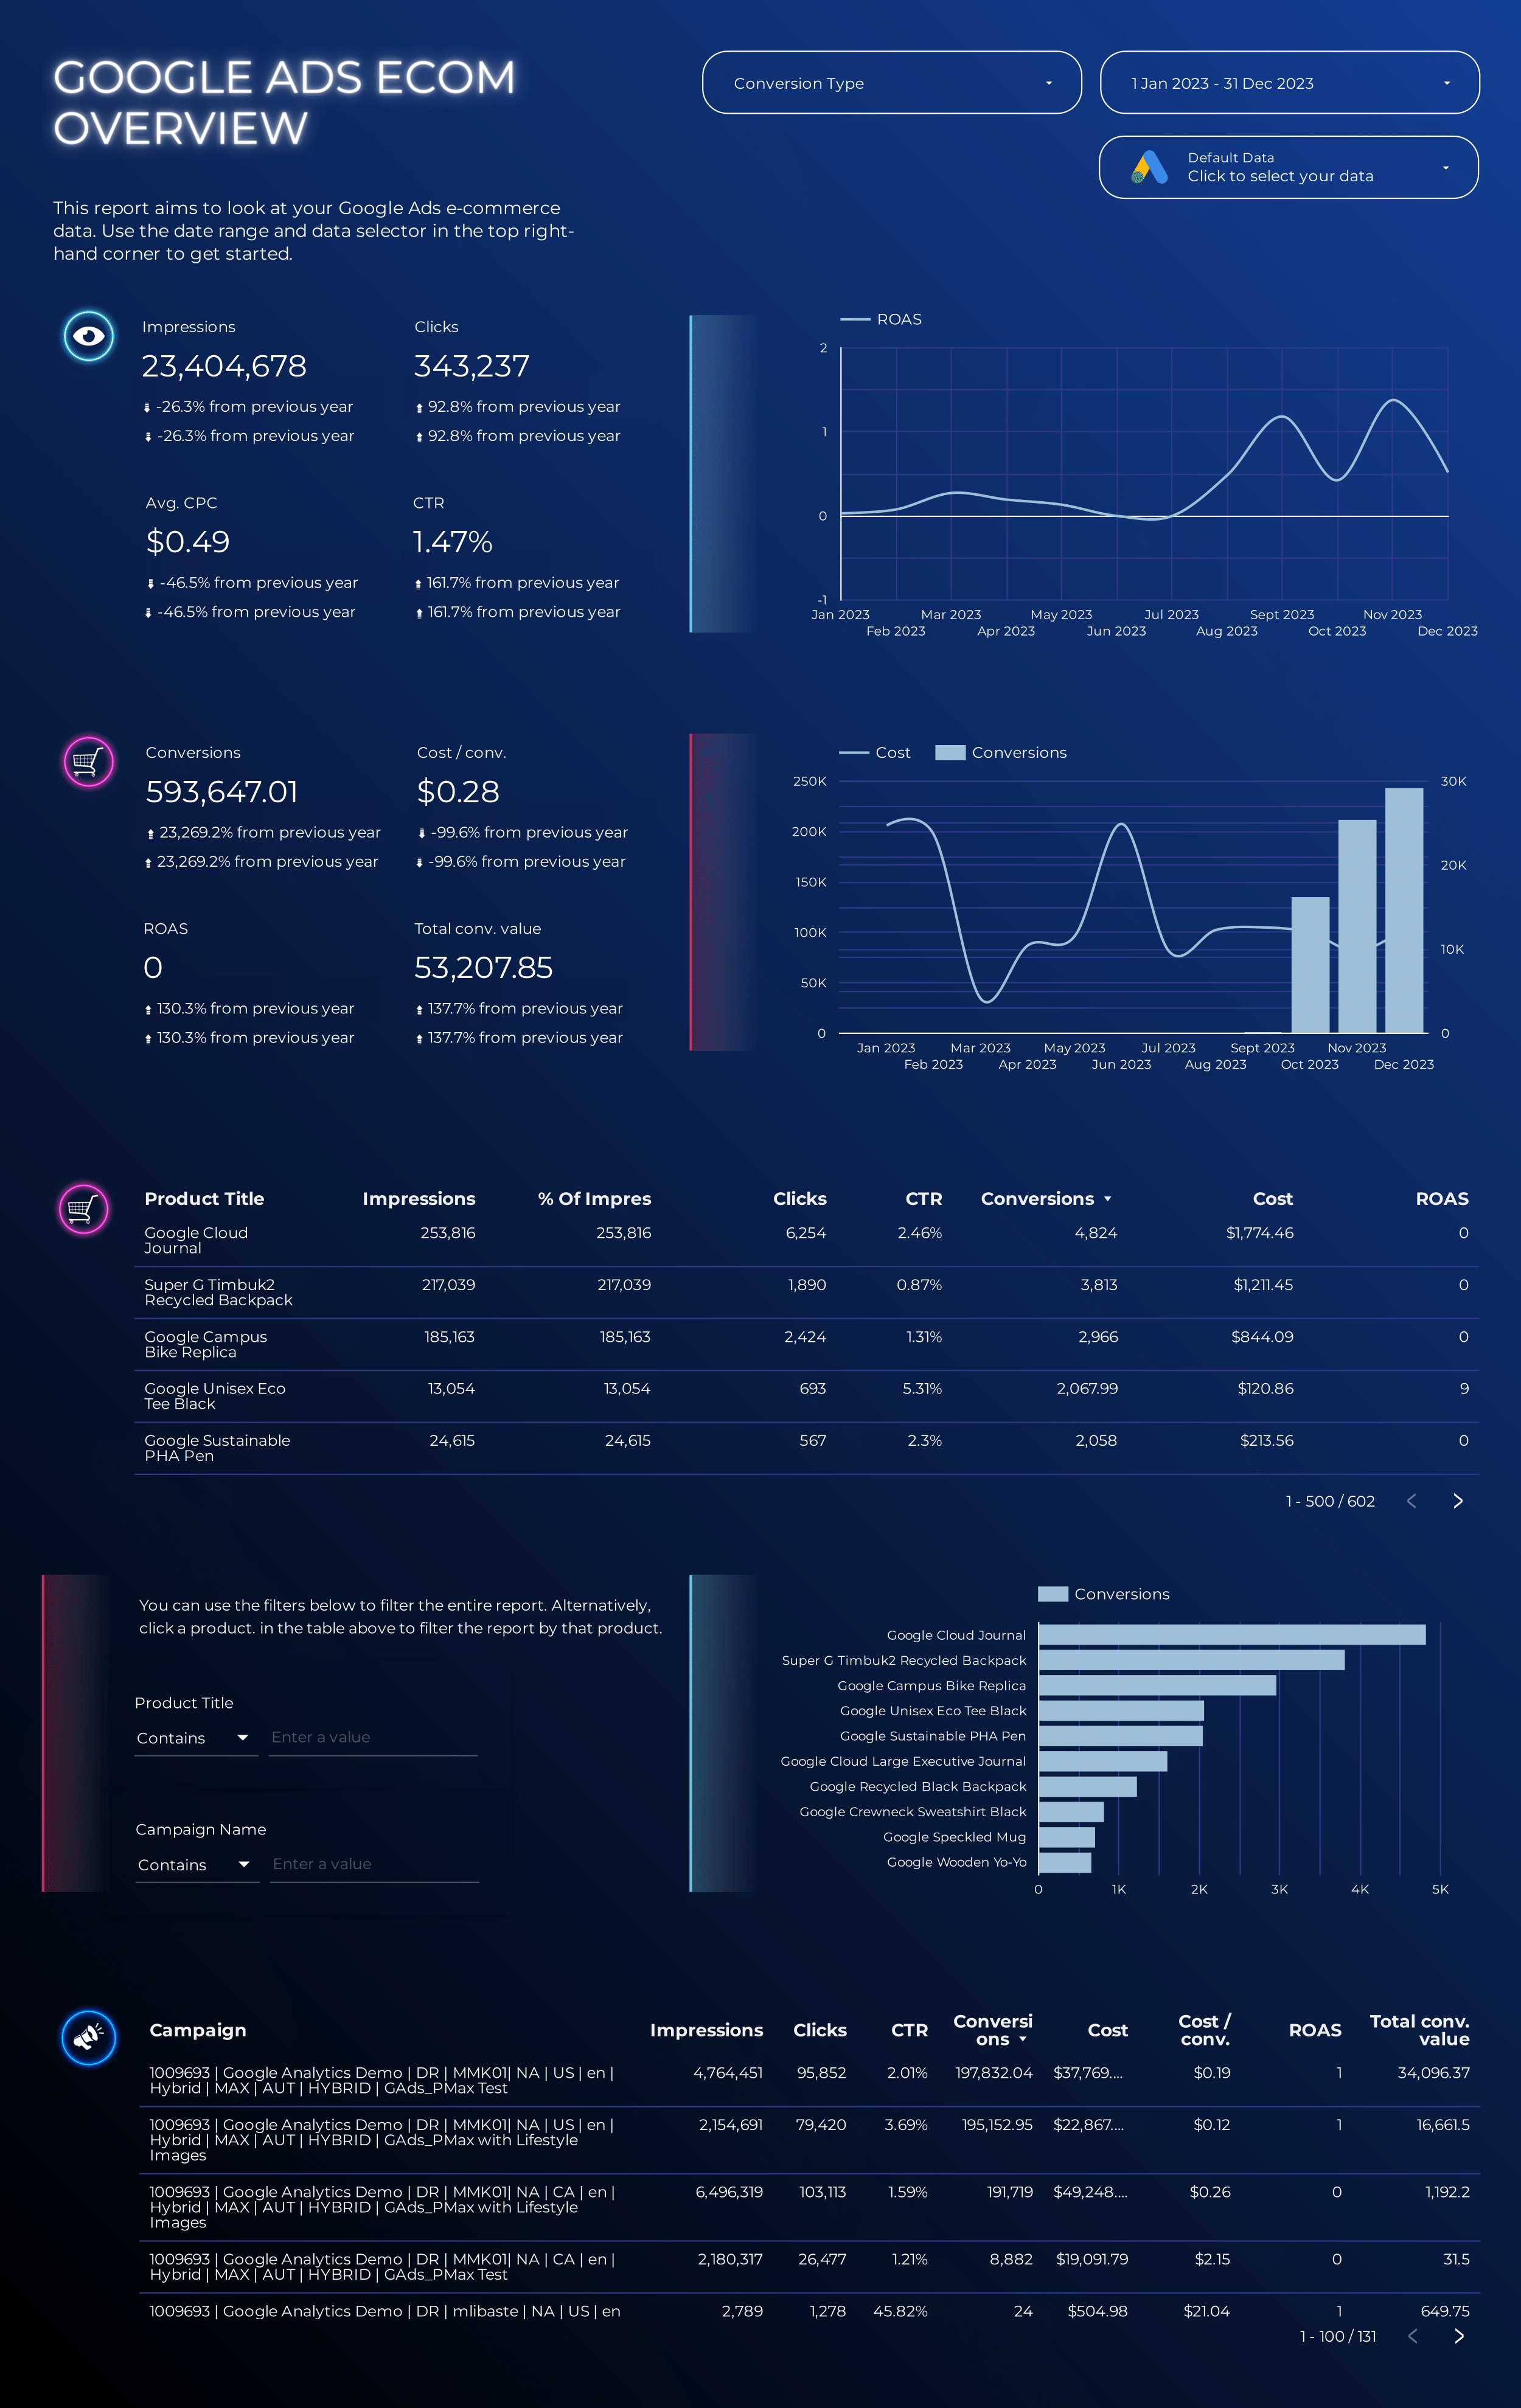
The Google Ads Performance Dashboard is designed to provide a straightforward, high-level overview of your Google Ads campaigns. Whether you’re running e-commerce campaigns or managing lead-based ads, this dashboard offers two dedicated pages to track and analyze your ad performance. Ideal for marketers, freelancers, and agencies who need to present clear, concise Google Ads reports without overwhelming detail.
About This Template
Purchasing this template grants you access to make a copy of the report in your own Looker Studio. By purchasing this template, you agree to our Template Usage Agreement.
What Questions Does This Report Answer?
How are my Google Ads campaigns performing?
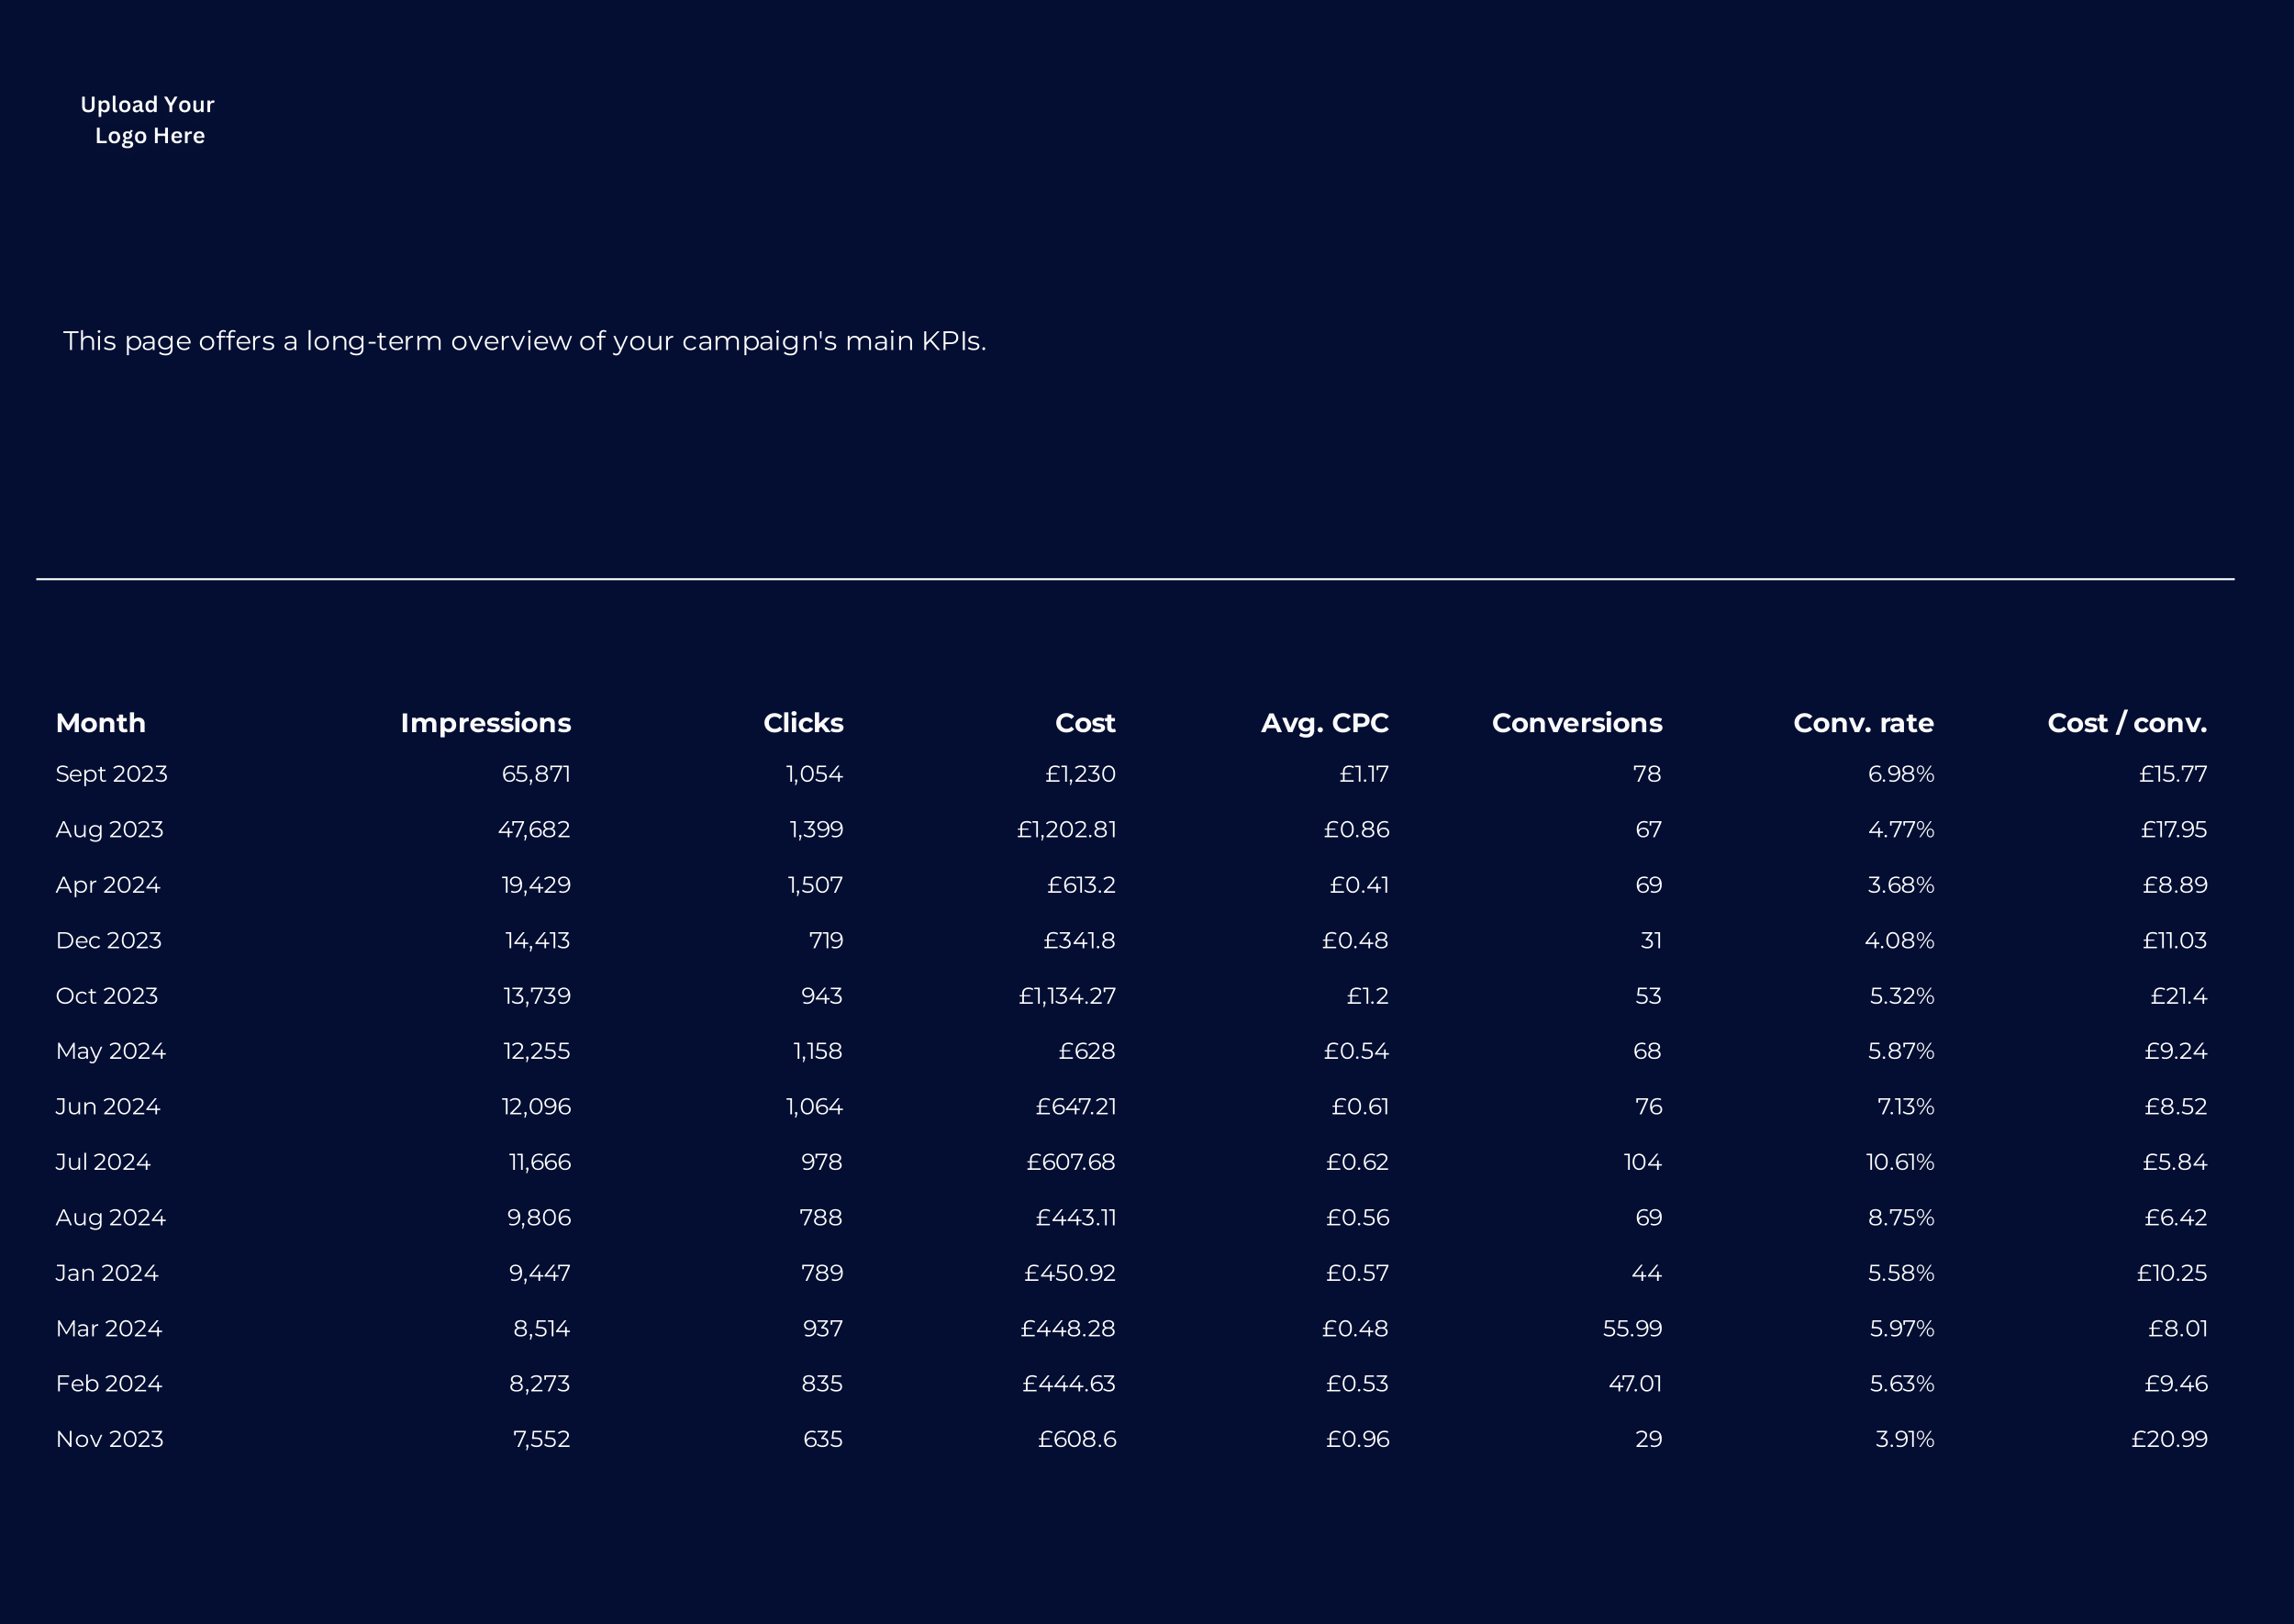
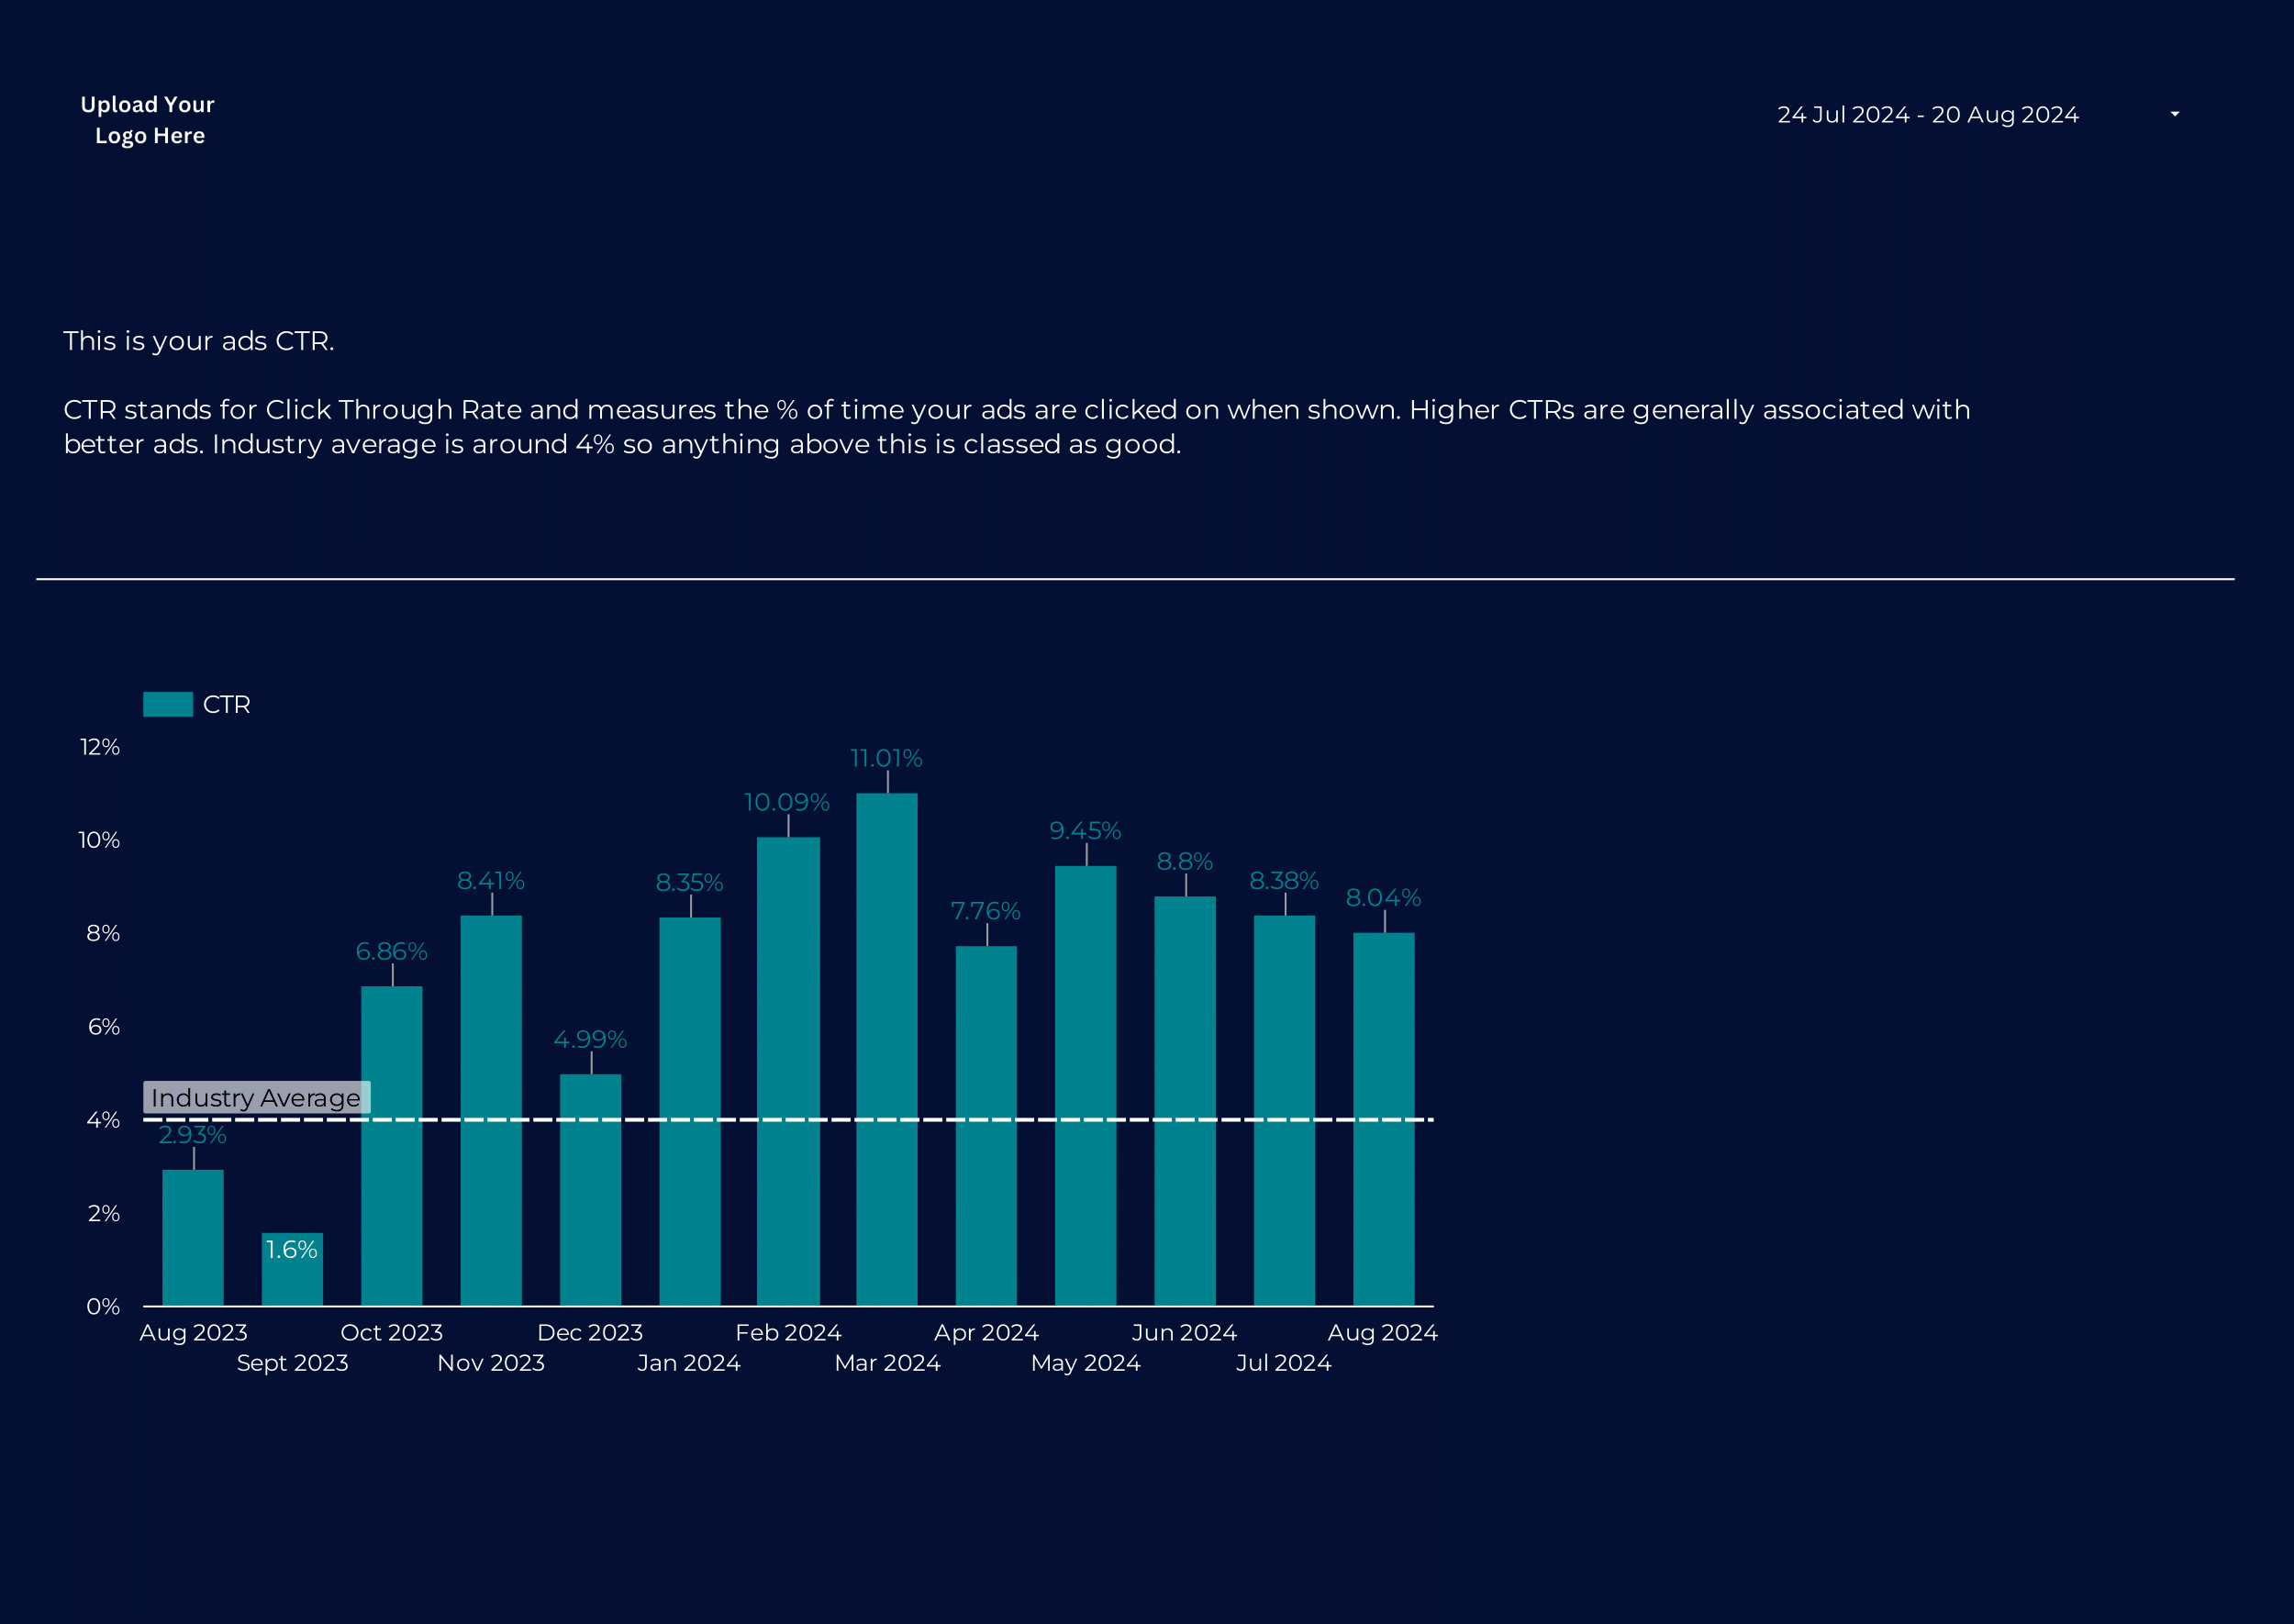
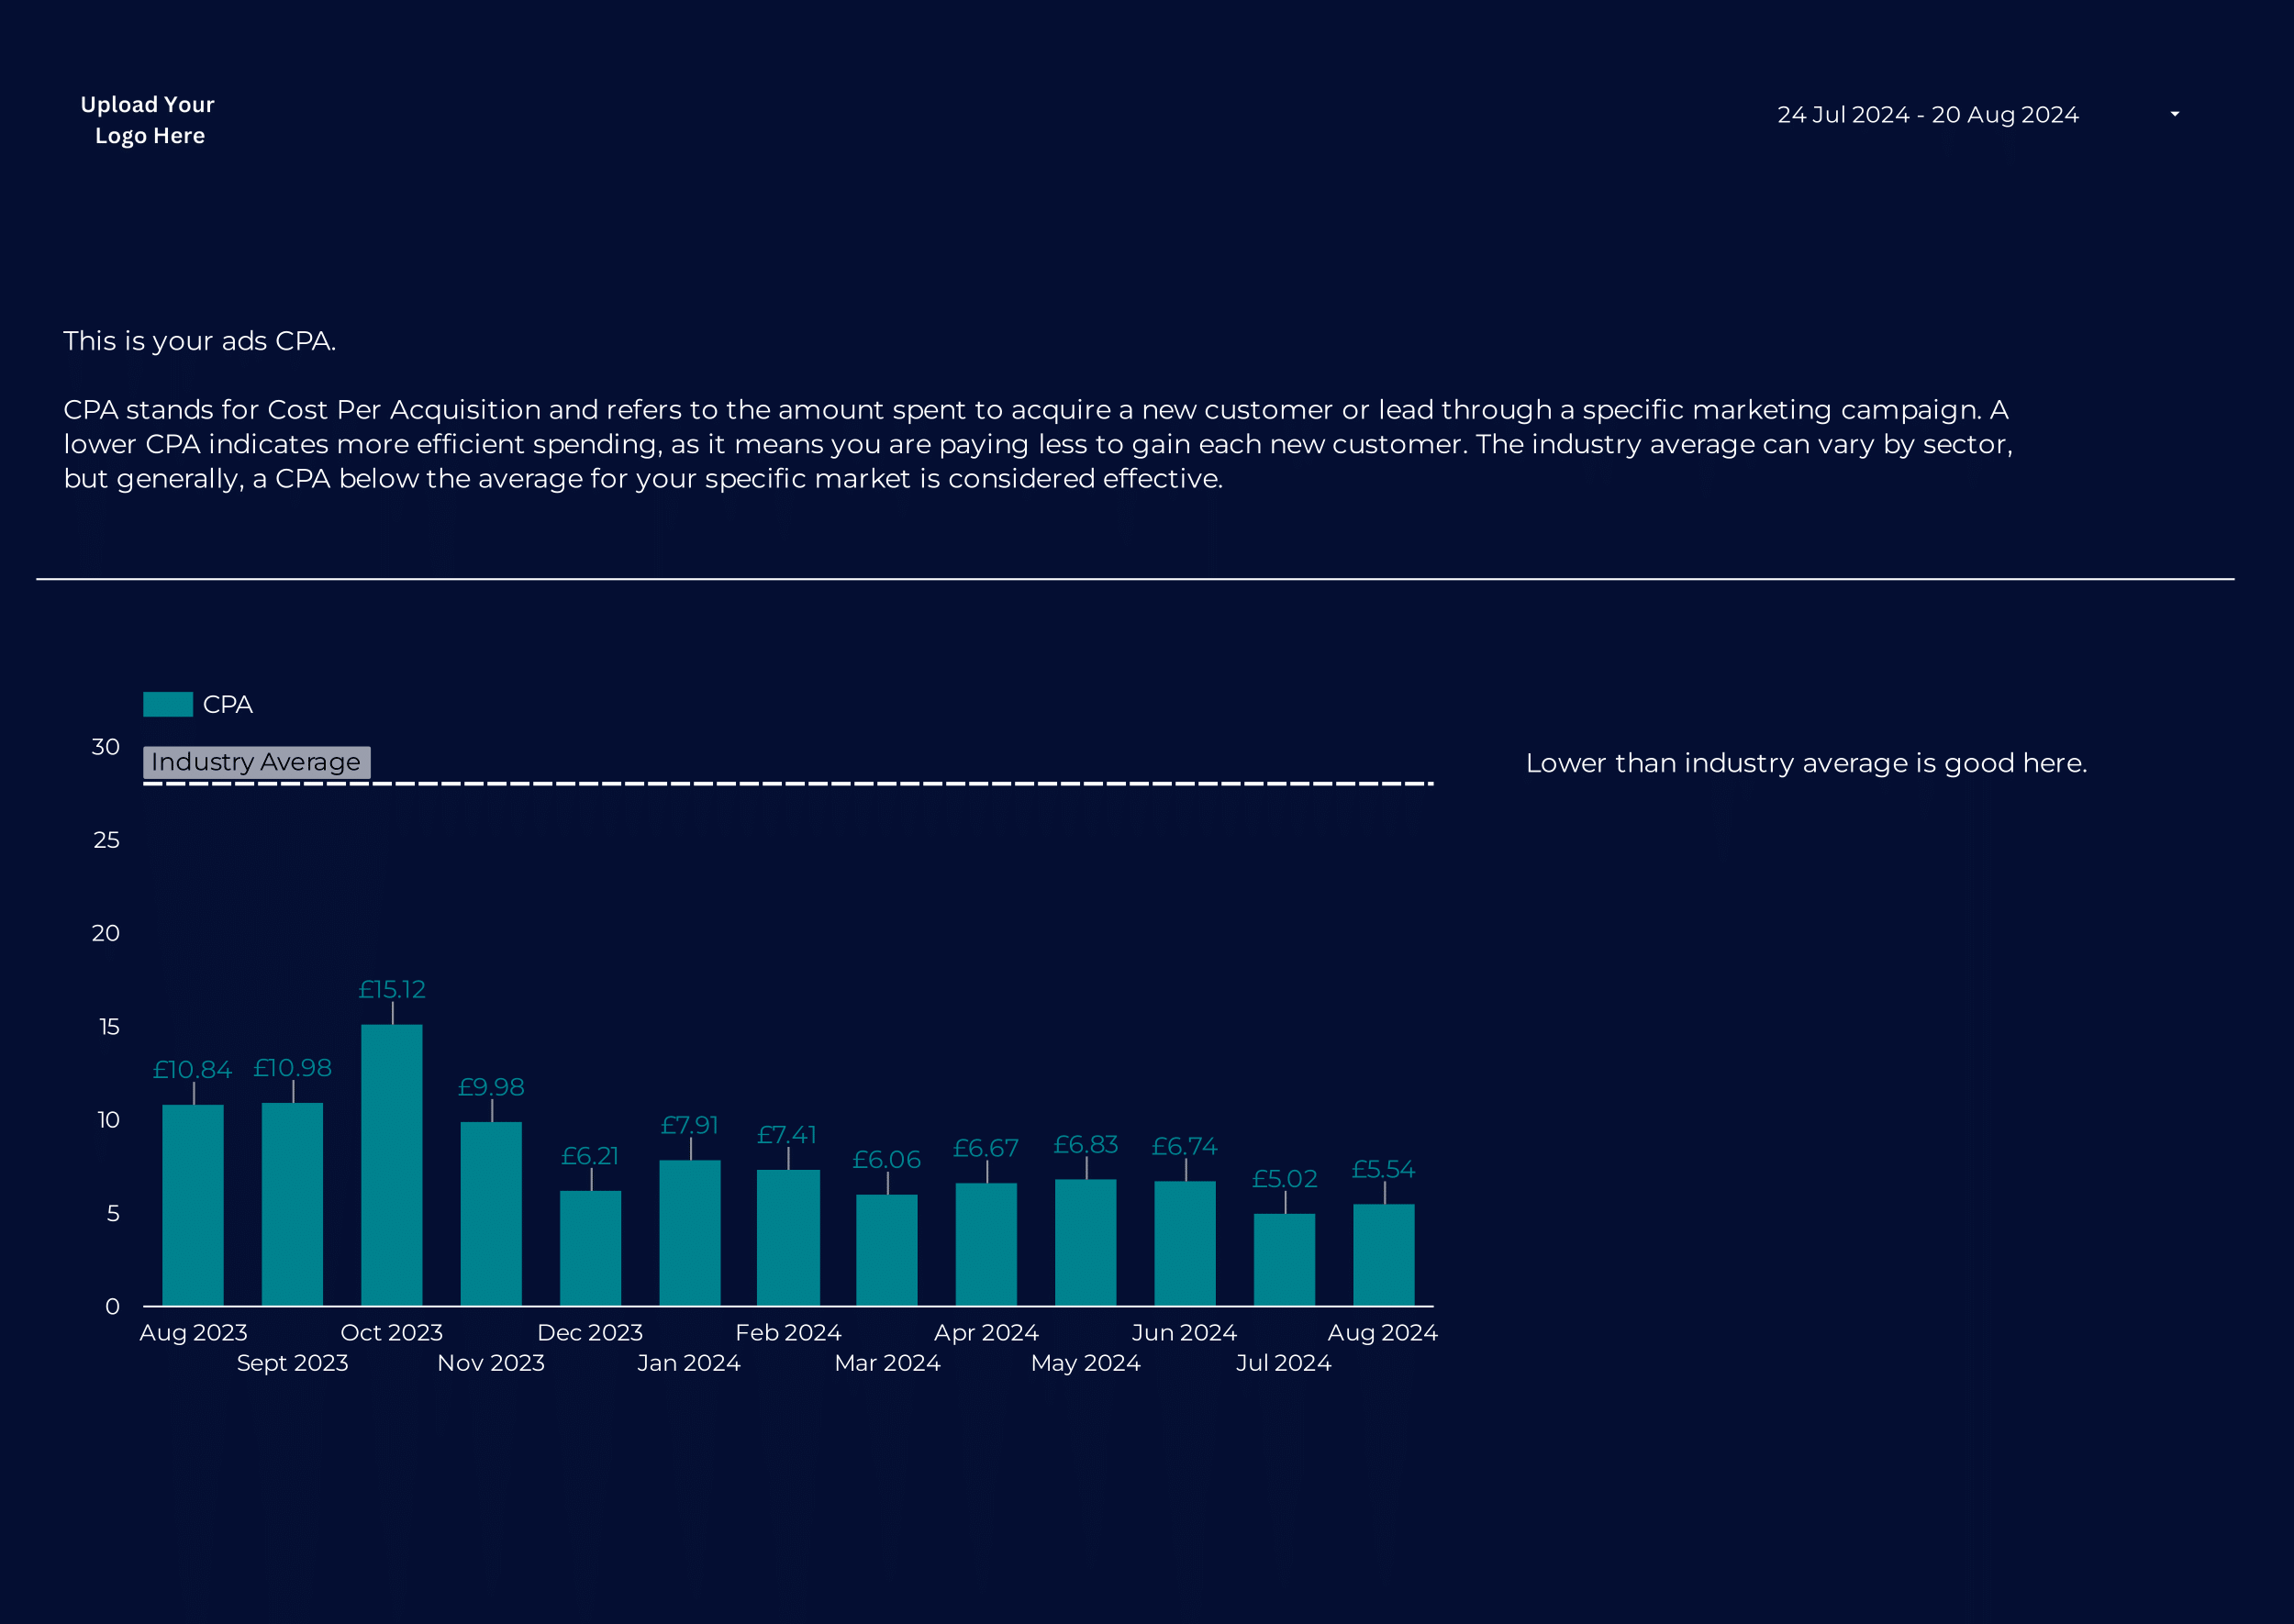
Get a quick snapshot of key metrics such as impressions, clicks, CTR, conversions, and ROAS across all your Google Ads campaigns.
Which ads are generating the most value?
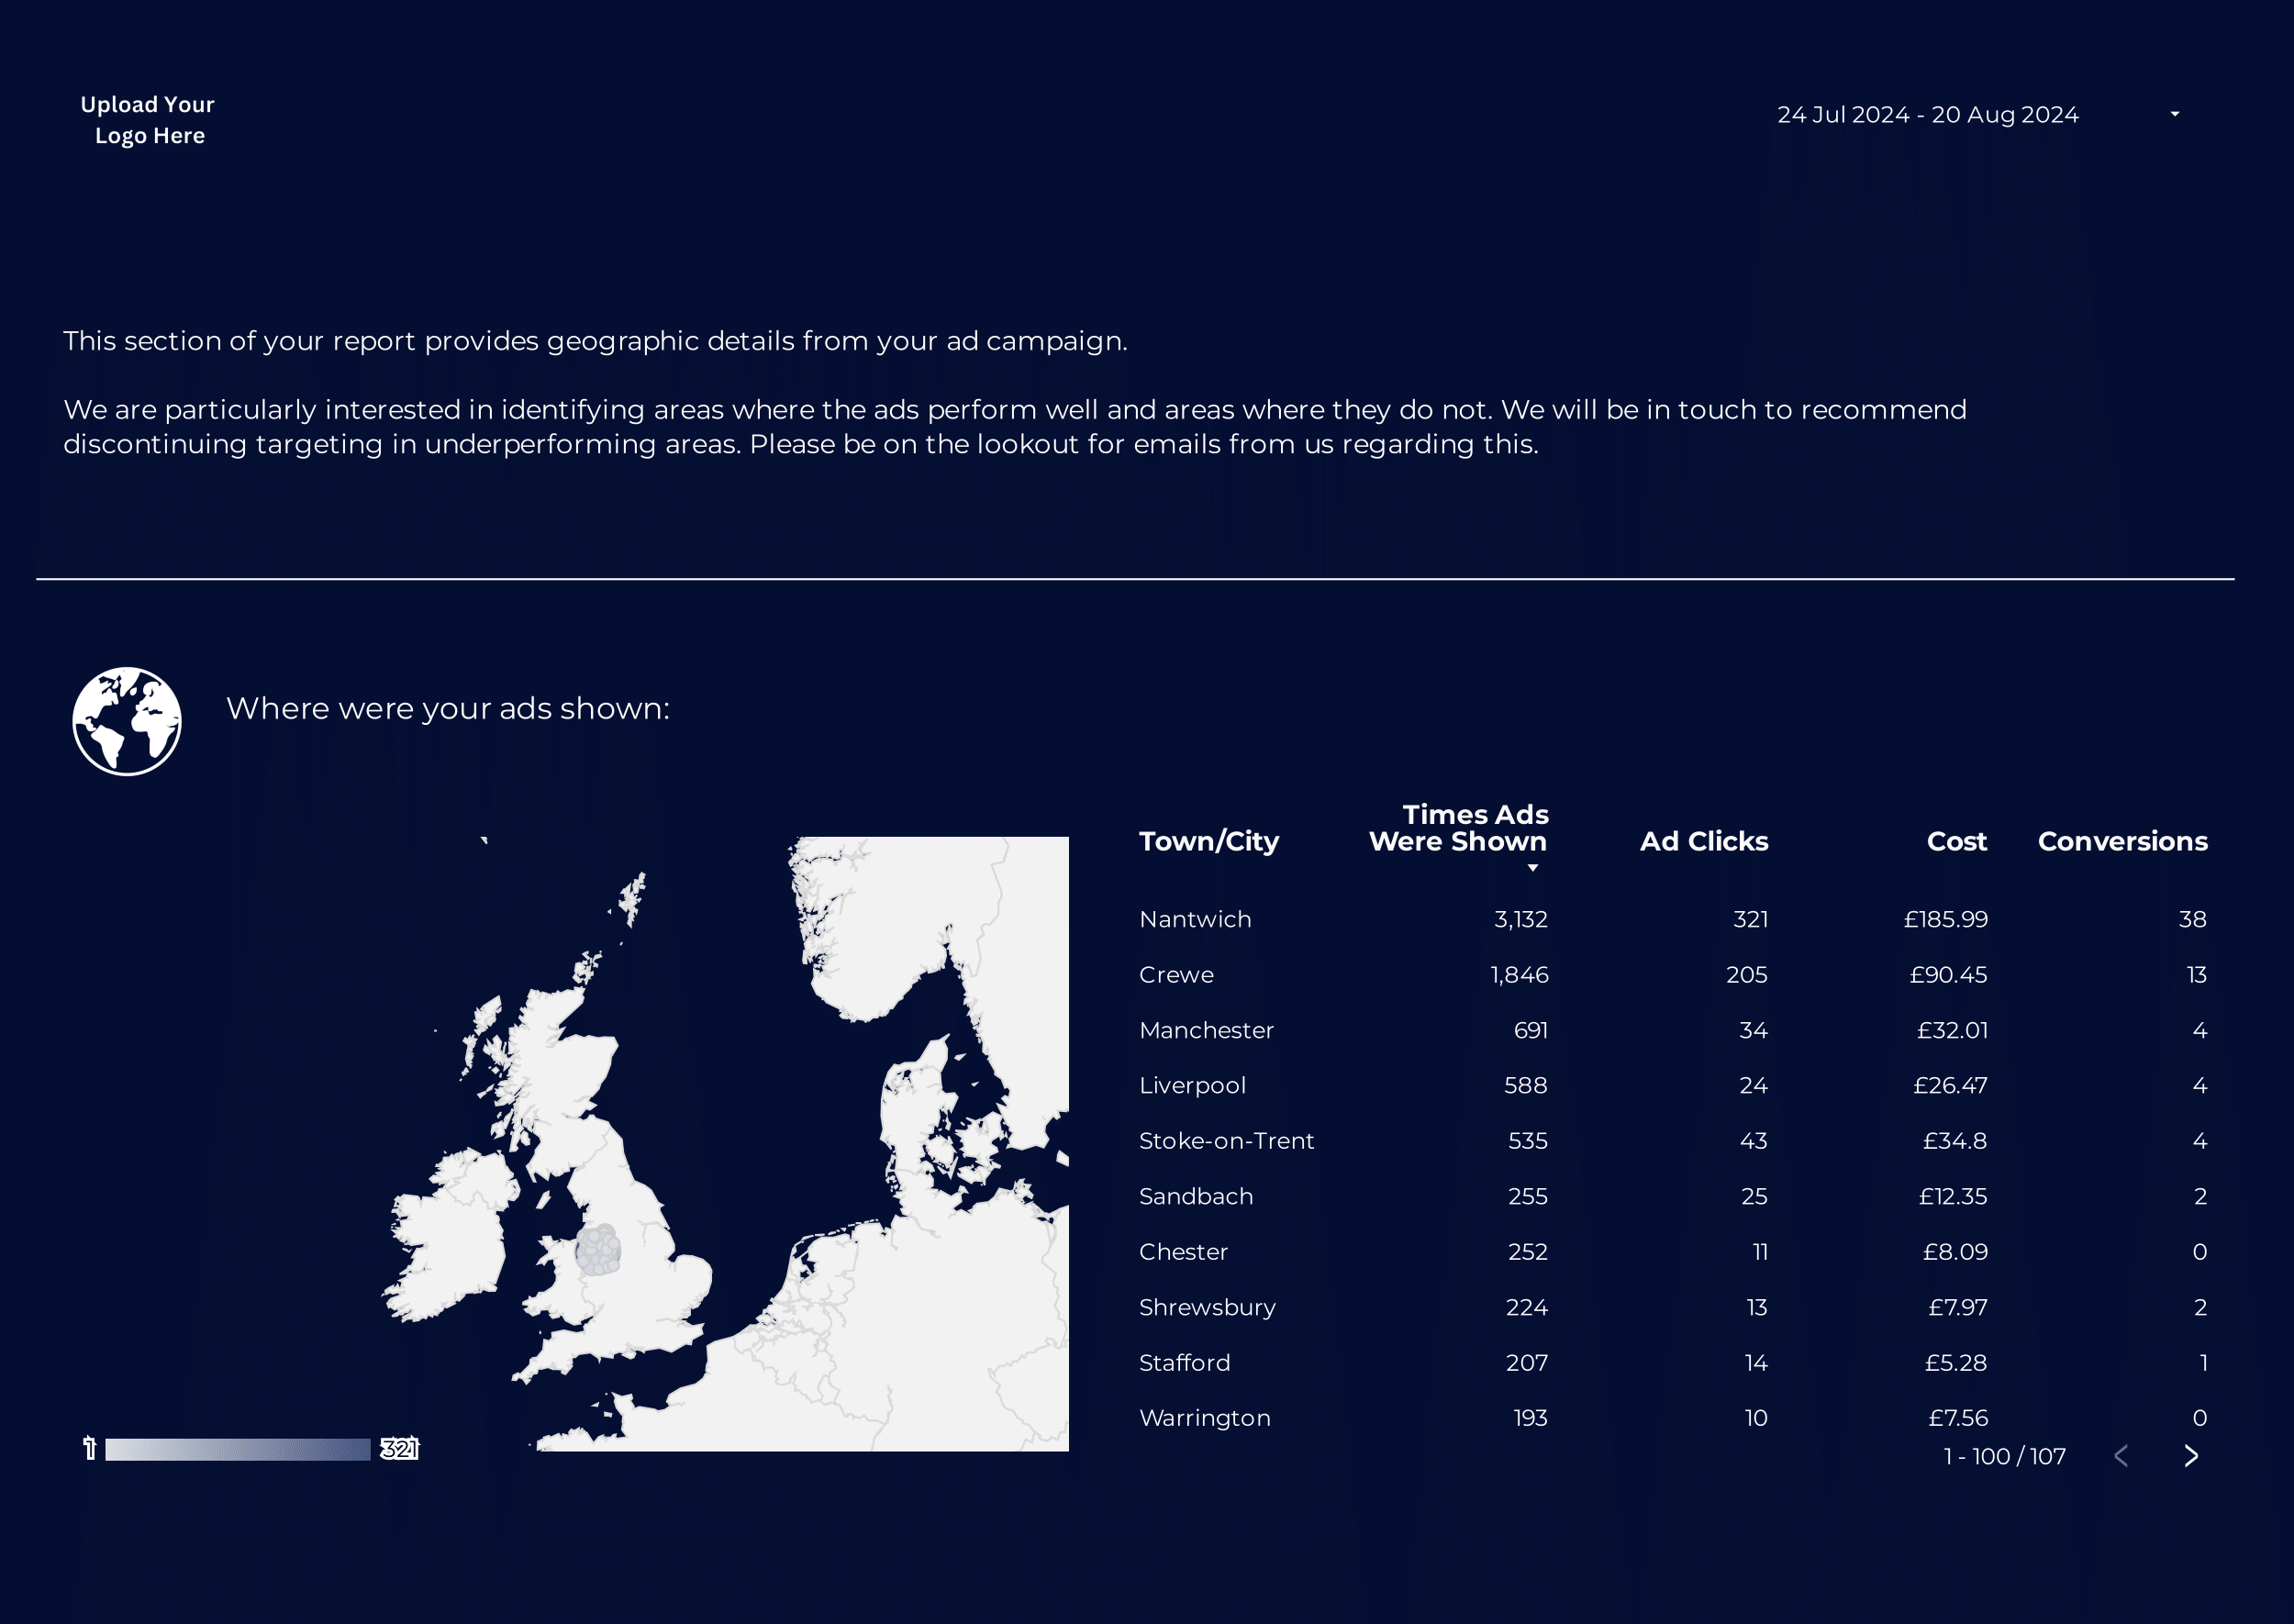
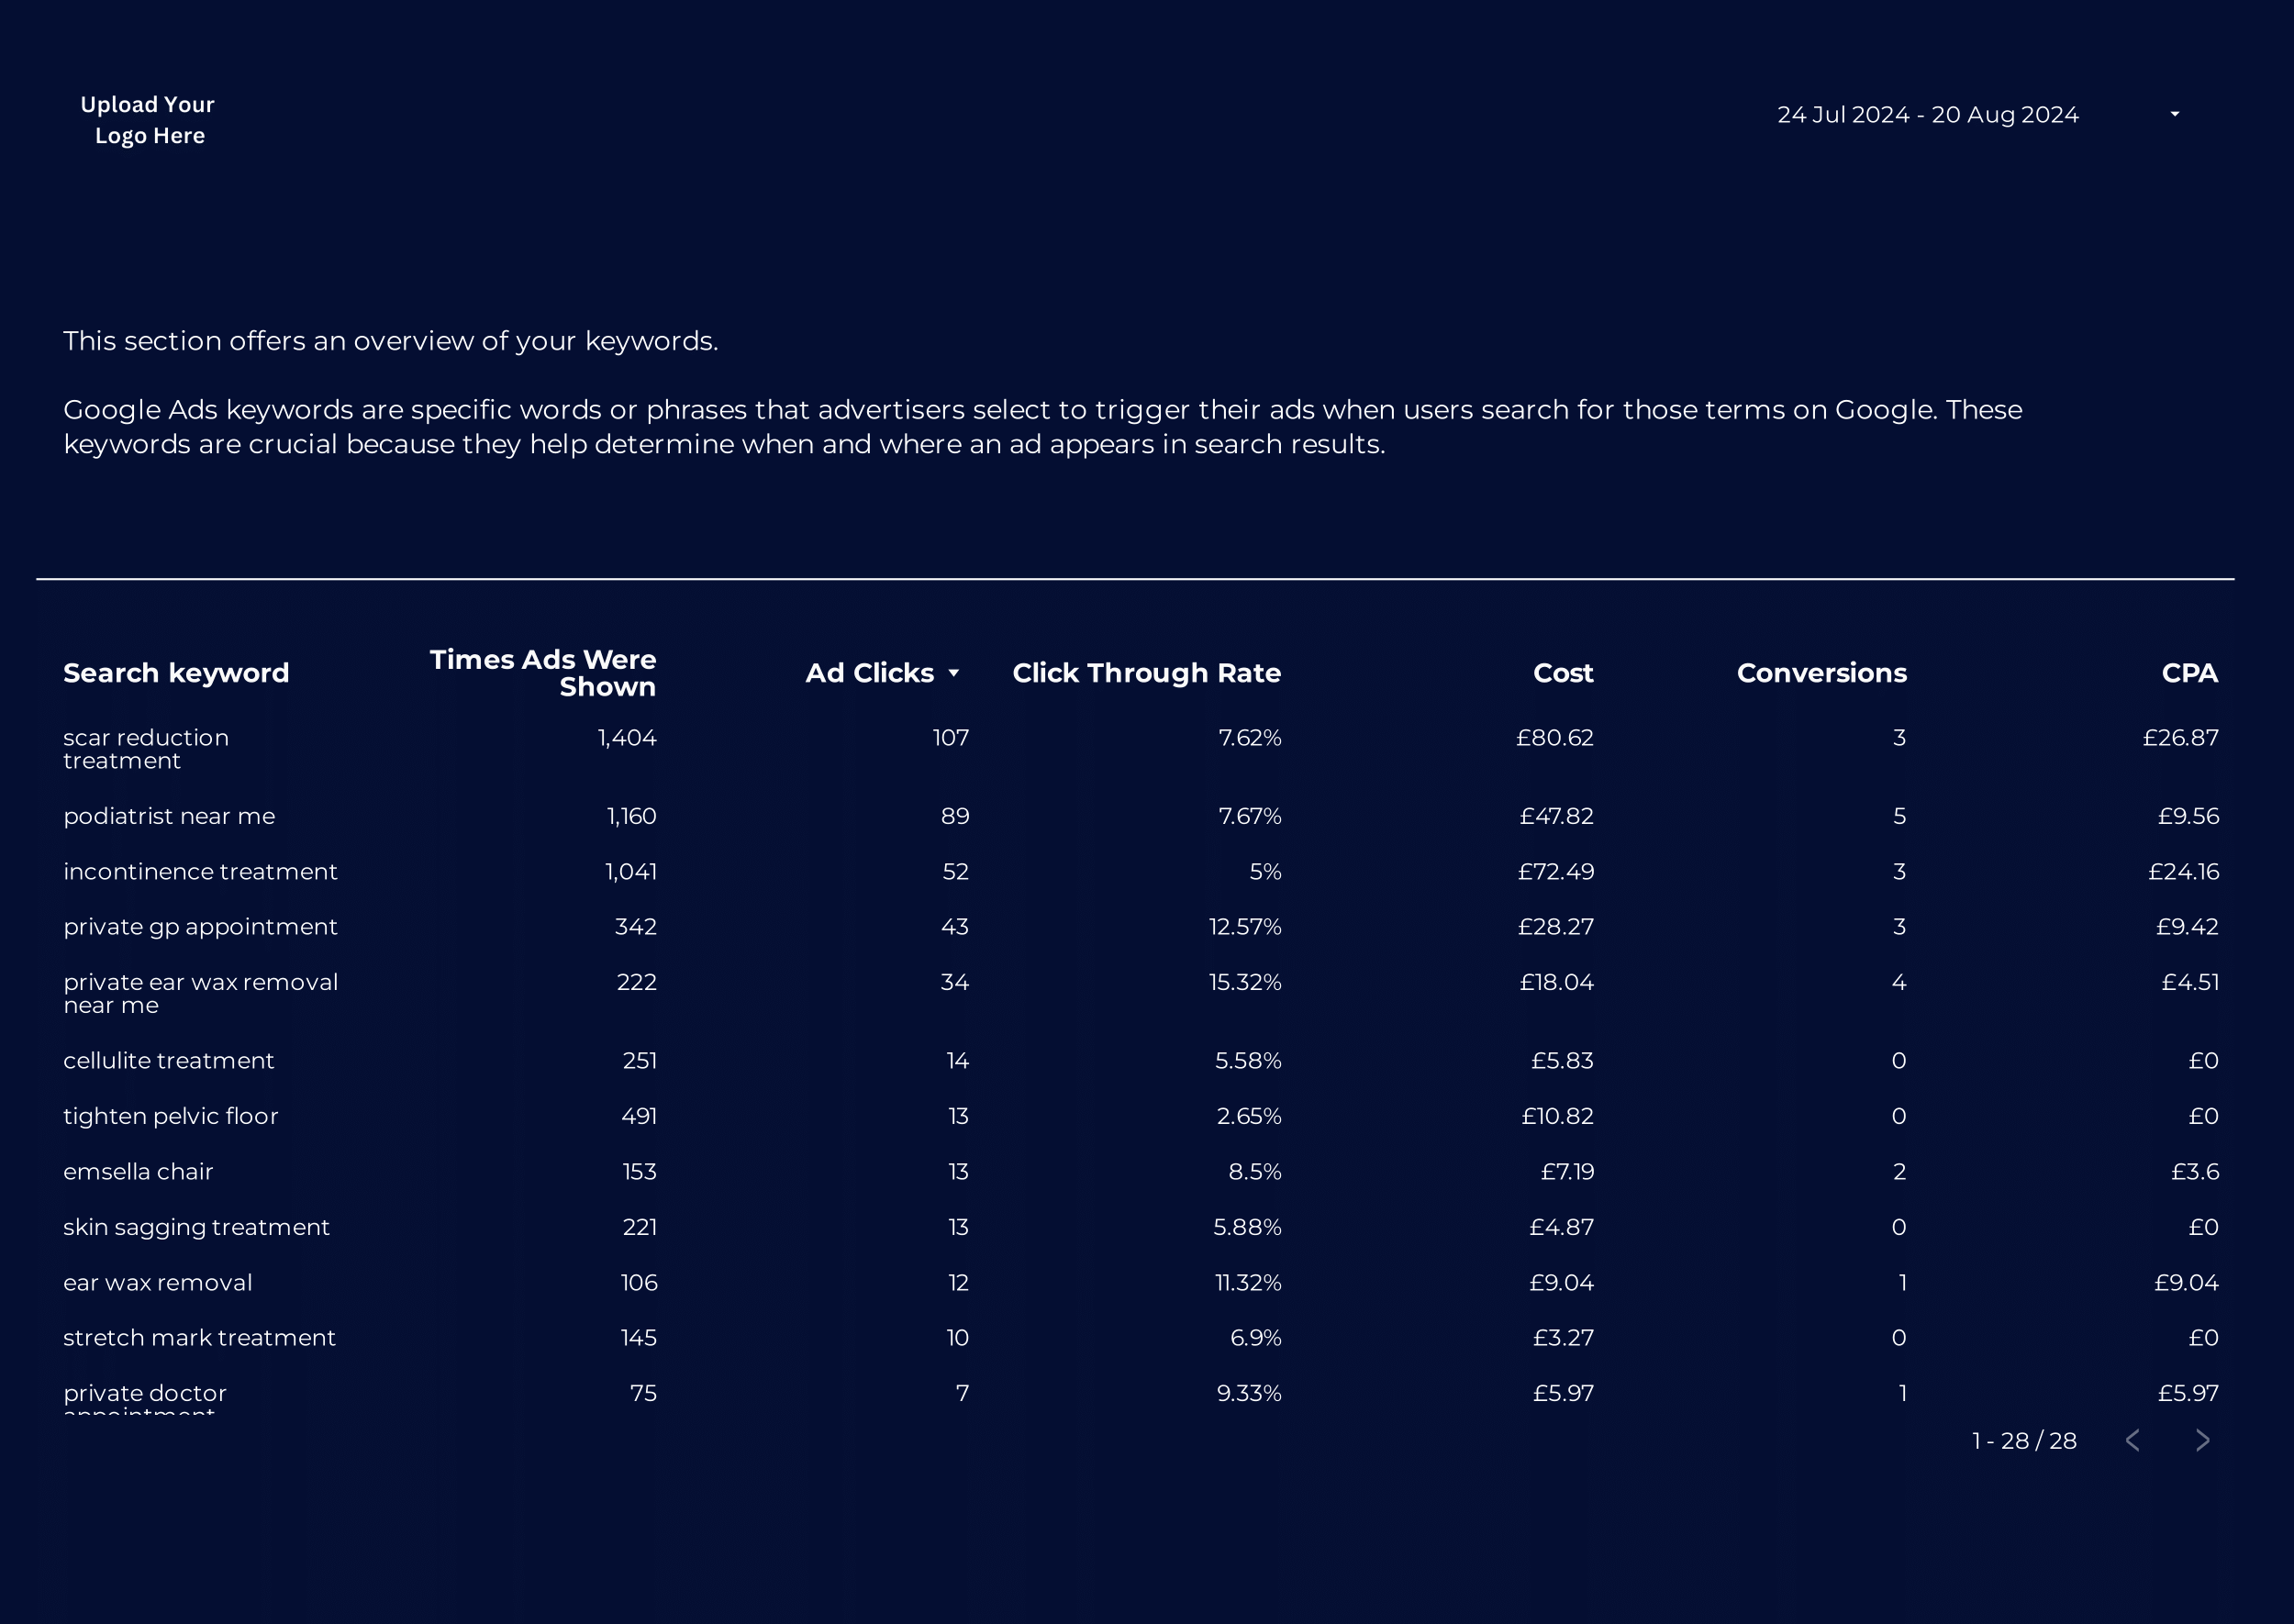
Analyze your top-performing campaigns, keywords, and products to understand where your ad spend is delivering the best return.
How do my e-commerce and non-e-commerce campaigns compare?
The dashboard includes separate views for e-commerce and non-e-commerce data, making it easy to evaluate performance across different campaign types.
What trends can I observe over time?
Track your Google Ads performance over time to identify trends, optimize your bidding strategies, and allocate your budget more effectively.
Key Features
Dual-Purpose Dashboard: Includes two pages—one tailored for e-commerce data and the other for lead-based campaigns—providing flexibility for different types of Google Ads accounts.
Essential Metrics: Focuses on the most important Google Ads metrics, such as impressions, clicks, conversions, and cost-per-conversion, ensuring you have the data you need without unnecessary complexity.
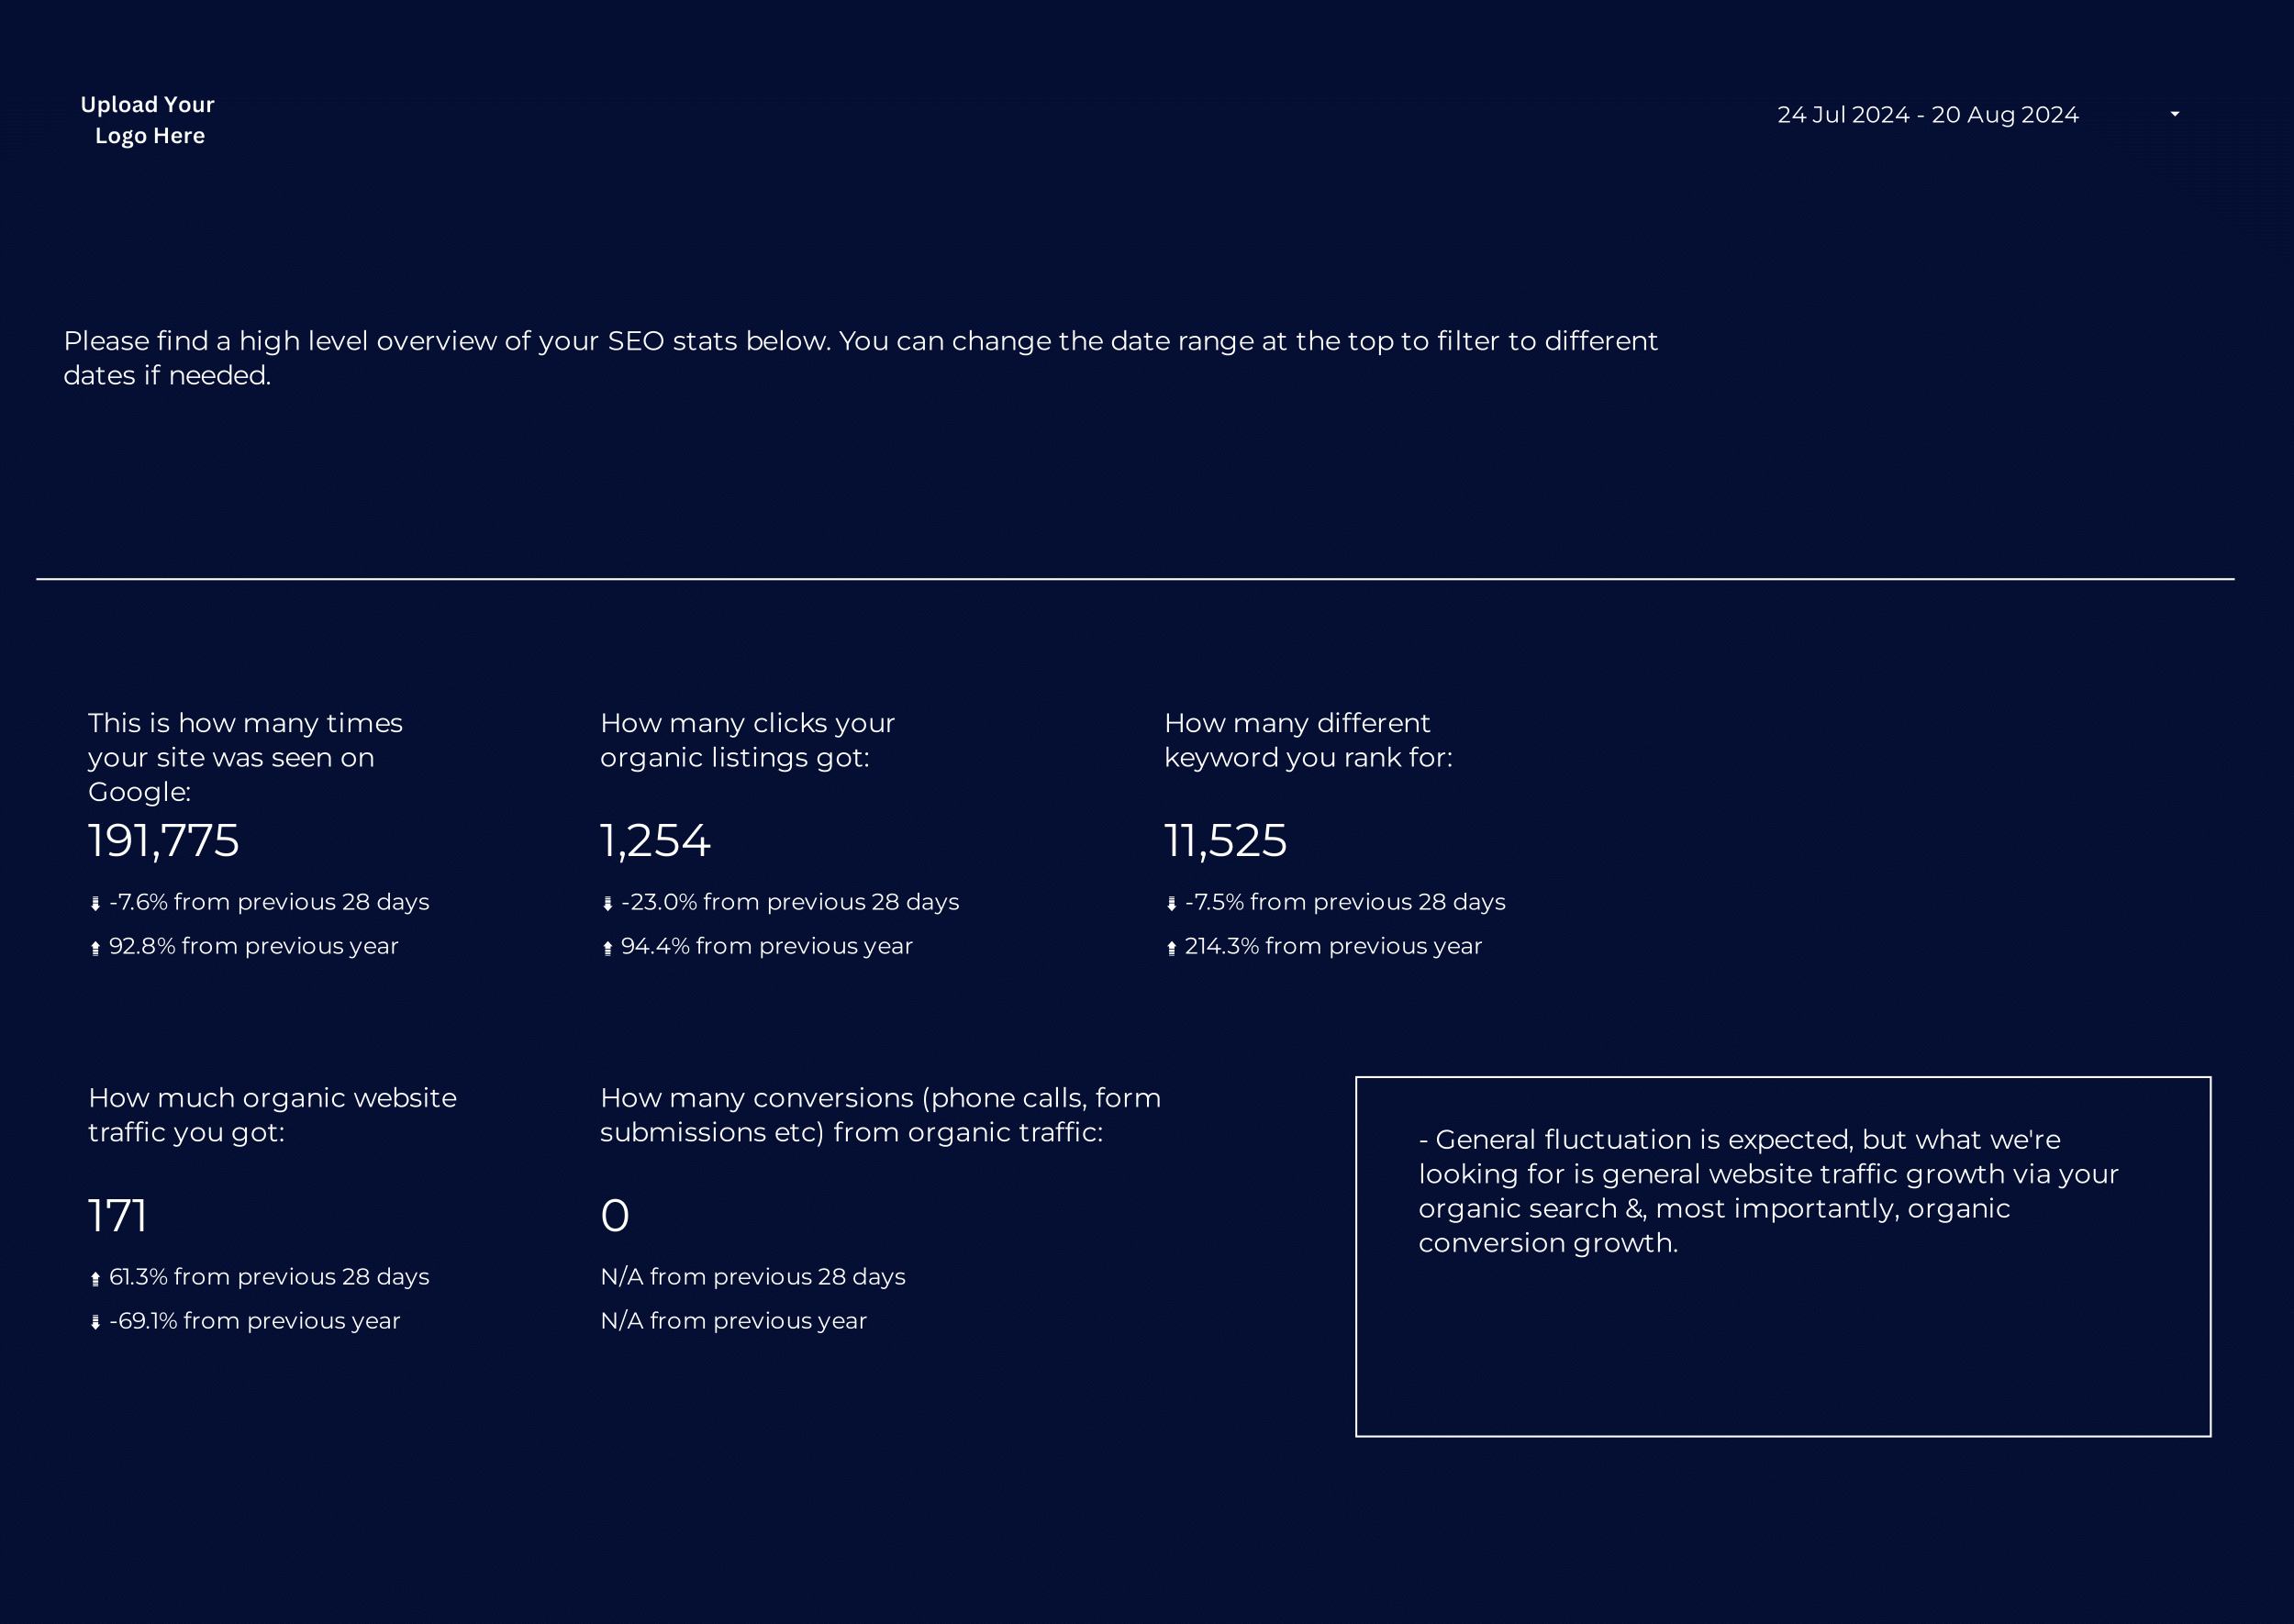
Clear Visualization: Simple, clean charts and tables make it easy to understand your Google Ads performance at a glance, perfect for quick reporting to clients or stakeholders.
Customizable Filters: Use the built-in filters to drill down into specific campaigns, keywords, or time periods, allowing for targeted analysis when needed.
How It Works
Purchase the Template
Buy the template from our store. After your purchase is complete, you’ll receive a confirmation email with a PDF document attached.
Receive a PDF Guide
The PDF guide includes detailed instructions and a link to the Looker Studio report. This guide will walk you through the process of accessing the report and making a copy for your own use.
Access the Looker Studio Report
Use the link provided in the PDF to access the Looker Studio report. Once you’re on the Looker Studio platform, you can follow the instructions to make a copy of the report.
Set Up Your Data Sources
After making a copy, follow the PDF instructions to connect your accounts to the report. This setup ensures your data is accurately reflected in the dashboard.
Customize and Share
Once your data sources are connected, you can customize the report to suit your specific needs.


